

If an individual has an understanding of the stock market, it’s highly likely that they might be in for a bright financial future. There are a variety of ways to approach the markets (e.g., investing in index funds, scalping stocks, trading options, identifying the next, big growth companies) but today we are going to focus on Swing Trading stocks and ETFs.
Swing trading is a strategy traders use to break through intraday noise to capitalize on price inefficiencies in markets.

The holding period can last from a couple of days up to a couple of weeks. This approach differs from day trading, which is a strategy that usually avoids carrying positions overnight. Day traders typically allocate more capital to their ideas (which often involves the use of leverage) and are often focused on making pennies and dimes rather than dollars. Technical analysis and pattern recognition are the primary skills used when Swing trading. Identifying stocks that are providing compelling technical setups is essential. Here’s how to start.
There are many tactics you can utilize when it comes to Swing trading, but the tried and true Technical Analysis strategies such as relative strength, moving average tests, and trendline breakouts are some of the strategies used by hedge funds and successful retail investors.
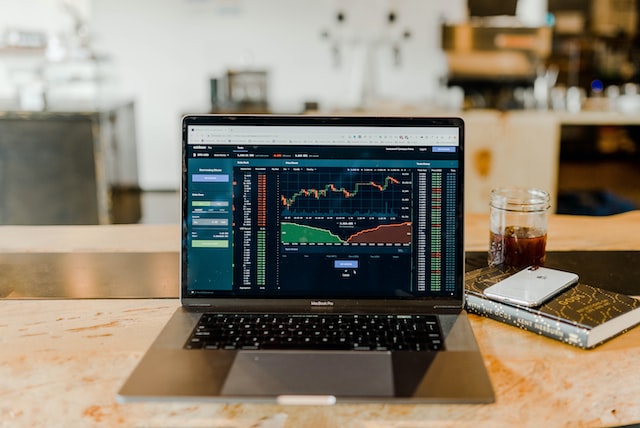
Briefing.com offers a variety of proprietary trading screens that focus on identifying the most attractive swing trading opportunities. This comes in handy when trying to narrow down trading ideas, to say a dozen, in a market that contains many thousands of stocks.
Relative Strength is a form of Technical Analysis that assumes a stock’s positive relative performance, to the markets or a benchmark, will continue into the future. It is based on a view that a stock’s outperformance is for a reason, and that this buy interest and price support will continue to drive the stock higher over time and be supportive of price on short-term pullbacks. For example, maybe a new Software company is experiencing widespread adoption at major companies. Without contacts in the Software industry, you may only be made aware of this information after the stock gaps 25% higher in reaction to earnings. That this stock steadily made new 52-week highs before the big blowout earnings report, even as the rest of the market was pulling back, is an example of Relative Strength.
Liquid Momentum is Briefing.com's proprietary Focus List for up to 50 of the most liquid, high Relative Strength stocks in the market that are ideal for Day and Swing trading high-quality names. It is generated from a proprietary algorithm that places heavy emphasis on superior Relative Strength versus the "all stocks universe," high Average True Range (ATR) values, and high Average Daily Volume, among a few other data points. An updated list is published by each Monday, along with some charts and commentary throughout the week highlighting the most compelling set-ups and patterns.
Changes to volume and volume levels are some of the most important trading signals for technical swing traders. Swing traders can gather a lot of valuable data from volume as it enables them to thoroughly analyze a market trend. To minimize the risk of bad trade, swing traders take volume into account, as a trend with higher volume is likely going to be stronger than the one with weaker volume.
If the Volume strategy is incorporated alongside the Relative Strength strategy, swing traders can capitalize when a breakout occurs, and volume levels confirm the underlying strength.
The levels of liquidity are indicators of market demand for that particular stock. Liquidity is calculated by how many shares per day are sold and stocks with high daily trading volume are considered liquid.
Great liquidity would be a $30 stock with a bid/ask spread of one penny. Poor liquidity would be a $30 stock with a bid/ask spread of $1.50. This stock would require a move of $1.50 before you could make money on your position.
Another important swing trading strategy is closely analyzing the volatility of the stock. Volatile stocks have a higher chance of breaking away from the trading range, which in turn could mean more profit for you.
Furthermore, analyzing volatility helps you decide whether the stock is worth investing in or not by carefully following the stock price movement. As a general rule of thumb, high volatility is not always bad, the best-performing stocks sometimes tend to be volatile.
To help them determine the volatility and choose whether they should invest in a stock, trading experts can use volatility indicators. At Briefing.com, our proprietary indicators generate ideas such as “Strong Volume Move Above Recent Resistance” and “Stocks Under $25 with Strong Up Momentum by Volume.”
Swing trading is a method of trading that can add up and make for a significant annual income. However, there’s a lot of work involved. Swing traders must know the basics of how to find stocks for swing trading and how to capitalize on trading opportunities.
Analyzing chart patterns, along with the strategies we outlined above will help your swing trading efforts play out in your favor. Knowing how to scan stocks for swing trading will take your position trading game to the next level.

")

