Analysis
Learn some investing and trading tactics as well as key data points to pay attention to when performing your own due diligence.
General Concepts
Brush up on some basic concepts before you invest or trade.
Strategies
Learn how to employ various investing and trading strategies.
Video
Watch and learn about the markets, different trading styles, and various asset classes with these webinars from our experts.
End-of-Day Review: Stock Market Analysis Features
The closing bell marks one of the most decisive moments in the trading day. It reflects where buyers and sellers ultimately agreed on value after hours of price movement and shifting sentiment. Investors use an end-of-day review to assess the strength or weakness of their positions and the overall market tone.
An effective end-of-day review can help you cut through intraday noise. A structured stock market recap highlights which sectors led, what catalysts moved prices, and how the major indices finished relative to key technical levels. This type of disciplined closing market analysis is especially useful for those wondering about end-of-day trading and how the close can influence the market.
For investors wondering how professionals prepare for the next session, a structured review of stock market analysis today provides clarity before tomorrow’s open.
Want to see today’s closing analysis in action? Subscribe now and follow the latest structured recap.
What an End-of-Day Review Should Tell You
An end-of-day review should give you more than a list of closing prices. It should explain what happened beneath the surface. Understanding the EOD stock meaning behind price moves is about interpreting the context behind the numbers on the screen.v
A structured review typically focuses on a few core areas:
- Index Positioning: How the indices settle often provides a snapshot of overall market conviction at the end of the session.
- Sector Rotation: This reflects how capital shifts between different parts of the market with the changes in leadership signaling evolving investor sentiment and broader positioning trends.
- Market Breadth: This shows whether gains were widely supported or concentrated in a narrow group of names.
- Volume Patterns: Volume patterns show how much conviction supported a move, which will help you confirm the strength of price action.
- Catalysts: Catalysts are the specific events, such as earnings or economic reports, that directly triggered the day’s price movement.
Having a daily market analysis helps you pull these elements together, enabling you to see the bigger picture rather than just reacting to isolated market movements.
Turning the Closing Recap into an End-of-Day Trading Strategy
A closing recap is most useful when it helps you prepare for tomorrow. That is the real purpose of an end-of-day trading strategy. You are not trying to predict the next market movement. You prepare for tomorrow’s trading session with a plan in place.
One of the first things to sort out is whether the day’s move looks like a continuation or a reversal of the recent trend. A strong close on broad participation often points to follow-through. A late fade or narrow leadership can signal the opposite. From there, you can start building tomorrow’s watchlist by focusing on the names and sectors that showed real strength.
The close is also a natural time for you to reassess risks. Sometimes your setup may look promising earlier in the day but may no longer fit your criteria by the bell. Other times, a stock that held up well into the close may deserve a closer look. Reviewing support and resistance levels after the session ends allows you to adjust calmly, without the pressure of live price swings.
Important Point: A strong end-of-day trading strategy starts with a review of how institutions established their positions into the close.
Use today’s structured recap and live commentary to sharpen your end-of-day trading strategy. Start your 14-day free trial to follow the workflow step by step.
Integrating Live Commentary into Your Workflow
End-of-day analysis becomes more powerful when paired with real-time context. Intraday commentary helps you see how news develops, how the market reacts in the moment, and whether early moves hold into the close. Earnings reactions often reveal where expectations were too high or too low, while analyst actions can shift sentiment quickly.
Tracking analyst activity through upgrades and downgrades briefing gives you updates and provides additional insight into institutional positioning. For a disciplined briefing investor, that context adds depth to the closing review. Instead of seeing only where the market finished, you understand how it got there and which developments truly shaped the session.
Using the Earnings Calendar to Anticipate Volatility
Earnings season can change the tone of the market quickly. In some cases, a single report can trigger sharp moves not only in one stock but across an entire sector. That’s why preparation matters before the closing bell.
Reviewing the Briefing.com Earnings Calendar before the close helps traders anticipate potential overnight volatility. If a company is scheduled to report after the bell or before the next open, that introduces gap risk. Prices can move significantly outside regular trading hours.
Knowing what’s ahead allows you to adjust position size, tighten risk levels, or step aside entirely. Instead of being surprised by the headline, you’re positioned with intention heading into tomorrow’s session.
Avoiding Common End-of-Day Mistakes
The close at the end of a trading day can provide clarity for your trades, but it can also tempt traders into drawing quick conclusions. Using a structured review helps prevent small misreads from turning into poor decisions.
Common mistakes to avoid include:
- Overreacting to a Single Stock: One dramatic move does not always represent the broader market tone.
- Ignoring Sector Confirmation: Finding strength in one security carries more weight when the entire sector supports it.
- Misreading Volume: If you find a price move that doesn’t come with meaningful participation, then it may not be as reliable.
- Disconnecting the Close from Futures: After-hours futures and global markets can influence the market.
Build a Repeatable Daily Discipline
Consistent market reviews can be a real advantage for traders. When you commit to a structured daily market analysis, you will find that patterns begin to stand out more clearly. Your ability to recognize trends builds confidence because your decisions are grounded in observation. Approaching stock market analysis today with a repeatable routine makes each session feel more deliberate and controlled.
Make Every Close Work for You
The closing bell should not be the end of your trading process. Use it as preparation for future trades. Briefing.com provides structured tools to help you refine setups and prepare for future market movements.
Start your 14-day free trial today and turn every close into a clearer trading decision.
How to Analyze Stocks: A Step-by-Step Guide
Buying stocks without performing an analysis beforehand means we are not investing but rather speculating.
Stock analysis is crucial to assess the potential profitability of stocks, so investors can decide which stocks can be considered good investment opportunities and which are not worth investing in.
There are various stock analysis methods available, but the most popular ones are technical analysis and fundamental analysis.
In this tutorial, you will learn all you need to know about analyzing stocks, and by the end of this tutorial, you'd have learned about:
- Technical analysis vs. fundamental analysis
- How to perform fundamental analysis on stocks
- Different technical analysis approaches and their implementations
- Important investing metrics to measure when analyzing stocks
And more. Let us begin this tutorial by discussing the definitions and key differences between technical and fundamental analytics methods.
Fundamental Analysis vs. Stock Analysis: Concepts and Key Differences
Technical analysis and fundamental analysis are two primary methods used to research stocks and make investment-related decisions.
While discussing the two can be a pretty deep subject on its own, the basic difference between the two analytics methods would boil down to:
- Technical analysis is performed by statistically analyzing market metrics such as transaction volumes, price movements, etc.
- Fundamental analysis is researching and analyzing financial and economic factors influencing a business's performance.
Technical Analysis in Stock Investing and Trading
Technical analysis refers to analyzing the available market data (i.e., transaction volume, price movements) to evaluate the current performance of a stock and predict its future value.
At the core of the technical analysis is the basic principle of economics: supply and demand. A stock with high supply but low demand would go down in value, and vice versa; securities that are high-demand but low in supply would increase in value.
Typically, stock analysts and investors use charts and other analytics tools in an attempt to identify and understand different patterns that might help them make investment decisions.
Technical analysis in stock investing is based on several key assumptions:
1. Prices move in trends. A very important assumption in technical analysis, the stock you analyze will follow a certain past trend rather than move randomly. Stock prices move based on short-, medium-, and long-term trends.
2. Only market price matters. Technical analysis only considers price movements, assuming that the stock's price already reflects everything that has or could affect a company's performance (and thus, the stock's performance.) With technical analysis, the stock analyst doesn't need to be concerned with fundamental factors like geopolitical and economic situations and only needs to be concerned about price movement analysis.
3. Repetitive nature of price movements. Another key assumption in technical analysis is the belief that market history tends to repeat itself due to market psychology. This is why evaluating historical data, and chart patterns is a core part of technical analysis in an attempt to analyze market emotions and understand market trends.
Technical Analysis Approaches Top-Down vs. Bottom-Up
In performing technical analysis for stocks, typically, there are two main approaches to choose from: top-down or bottom-up.
1. Top-down approach
In a top-down technical analysis, the analyst would first perform a macroeconomic analysis that analyzes the price history of the whole economy before analyzing the individual stock.
For example, the analyst would first focus on analyzing economies, then sectors, then industries, then the company.
The investors using this approach typically focus on gaining short-term rather than long-term investments.
2. Bottom-up approach
As opposed to the top-down approach, the bottom-up technical analysis approach focuses on analyzing the individual stock's price history first before looking at the macroeconomics.
A typical use case of this approach is when an investor identifies an undervalued stock that is currently in a downtrend (via fundamental analysis), then uses bottom-up technical analysis to identify potential entry and exit points for this specific stock.
In most cases, investors looking for short-term profits may use the top-down analysis approach, while medium-term and long-term investors may be more comfortable with the bottom-up approach.
Fundamental Analysis in Stock Investing and Trading
In fundamental analysis, a stock analyst or investor analyzes various quantitative and qualitative fundamental factors (i.e., economic, financial, geopolitical, etc.) in an attempt to determine a stock's intrinsic value.
The basis of fundamental analysis is the belief that microeconomic and macroeconomic factors like industry conditions, geopolitical situations, and the company's management proficiency can cause a stock's value to go above or below its intrinsic value.
Thus, the main objective of fundamental analysis is to determine the stock's intrinsic value (how much the stock should be worth) and compare it with the current market price of the stock to determine whether the stock is currently undervalued (and, thus, should buy more), or overvalued (and should ideally sell.)
Here are the basic steps of performing fundamental analysis of stocks:
- Understand the company: A very important first step of any fundamental analysis is to have a thorough understanding of the company you are evaluating. In this digital age, it's relatively easy to gather information about a company by visiting its website and social profiles, as well as studying publicly available reports and statements of the company.
- Analyze financial statements: A key aspect of fundamental analysis is a thorough evaluation of the company's financial situation (revenue, expenses, operational costs, cash flow statements, profit/loss statements, balance sheet, and so on.) Evaluate whether the company's financial situation is healthily growing year by year.
- Competitive analysis: Evaluate a company's performance compared to its competitors. You should invest only in companies that are performing better than their competitors both in the present and in the future (better future projects and plans.)
- Evaluate debt: A stock of a company with a lot of debt won't be able to perform well, even if the other financial factors look healthy. In general, investors should look for a company with a debt-to-equity ratio of less than 1.
- Longevity: Fundamental analysis is more useful if you are going to commit to long-term investment. Evaluate whether a company is future-proof (i.e., whether its product/service would still be in demand 20 years in the future, expansion plan, diversification plan, etc.)
Another key consideration when using fundamental analysis in stock investing is that it shouldn't be a one-off thing, but you should review and stay updated about the stock you have invested in from time to time.
This is important to offset the limitation of the technical analysis that solely focuses on price history. Stay updated about the stock's financial performance, and don't hesitate to sell if there's a problem in the company.
Fundamental vs. Technical Analysis: Key Differences
As discussed, technical analysis is only focused on analyzing historical price movements to predict future prices, while fundamental analysis is about analyzing the microeconomic and macroeconomic factors that influence the company's performance.
With that being said, there are two key factors in which fundamental analysis and technical analysis differ from each other.
Short-term vs. Long-term
Fundamental analysis is more geared toward long-term investment. The main objective of fundamental analysis is to wait until a stock's current price is undervalued when compared to its intrinsic value, which can take a long time.
On the other hand, in technical analysis, the stock chart can be delimited to identify short- to medium-term trades where the investor can earn quick profits.
Analysis instruments
The main analysis instrument in technical analysis is the stock charts, with the key assumption that the company's price history already reflects everything that has or could affect the company's performance (and thus, stock price.)
In fundamental analysis, on the other hand, the main analysis instruments are the company's financial statements: balance sheets, profit/loss statements, cash flow statements, and so on. The goal of studying these financial statements is to determine the stock's intrinsic value, mainly by discounting the value of future projected cash flows to the net present value.
Important Metrics in Fundamental Analysis
As discussed, the fundamental analysis relies on evaluating various metrics in the financial statements, with the objective of identifying the stock's intrinsic value.
Here are some of these important metrics:
Earnings per Share (EPS)
A company with high earnings per share typically translates into a higher intrinsic value since investors tend to purchase a stock when earnings are high.
Price-to-earnings (P/E) Ratio
The price-to-earnings ratio, or P/E ratio, is the company's stock price divided by its annual per-share earnings.
The P/E ratio is useful in fundamental analysis to help identify the intrinsic value of a stock by comparing the stock's P/E ratio to its competitors and industry standards.
The lower the P/E ratio is, the less expensive the stock is relative to the earnings it is expected to deliver.
Price-to-earnings-growth (PEG) ratio
The PEG ratio is calculated by dividing a stock's P/E ratio by the expected growth rate of the annual earnings over the next few years (typically the next five years).
For example, a stock with a P/E ratio of 10 and 10% expected annualized earnings growth over the next five years would have a PEG ratio of 1.
A low PEG ratio, especially if it is less than 1, is often seen as a good value opportunity.
Price-to-book (P/B) ratio
The price-to-book ratio is a company's stock price divided by its book value.
The "book value" is the net value of a company's assets. That is, if the company closes its operations today and sells everything, the book value is the amount of money it would theoretically have.
A low P/B ratio is a sign that the stock is potentially undervalued (and could be a good buy).
Debt-to-EBITDA ratio
As discussed above, a key element of fundamental analysis is to evaluate a company's debt, and the debt-to-EBITDA ratio is among the most useful metrics to do so.
EBITDA stands for earnings before interest, taxes, depreciation, and amortization, and the debt-to-EBITDA ratio can be calculated by dividing the total debts on a company's balance sheet by the EBITDA.
TA high debt-to-EBITDA ratio may signify that the stock is a high-risk investment.
Return on Equity (ROE)
Return on equity, or ROE, is calculated by dividing the company's net income by the average shareholders equity.
In fundamental analysis, we can evaluate the return on equity to determine how well a company generates positive returns on its shareholders' investments. In short, companies with high ROE are profit generators.
Investors would like to find companies with high ROE that is continuously increasing.
Qualitative Factors to Consider in Fundamental Analysis
Besides the quantitative metrics, there are also qualitative factors that you should watch in fundamental stock analysis:
Management quality
No matter how well a company is currently performing financially, it won't sustain its performance if it's managed by the wrong people. Evaluate whether the management team behind the company has adequate expertise and experience.
Also, align whether the company's main executives have financial interests that align with shareholders' interests.
Sustainable growth and competitive advantages
Evaluate whether the company will be able to sustain and grow its market share over time by having a sustainable advantage over its competitors.
Durable competitive advantage (known as the economic moat) can come in many different forms: powerful distribution network, patents and trademarks, and so on.
Industry and sector trends
Evaluate whether the company is in an industry or sector with high potential long-term growth. If it's in a relatively slow or dying industry, you should be reasonably cautious.
Wrapping Up
Stock analysis is crucial when making investment decisions to determine whether a stock is worth investing in.
There are two popular stock analysis techniques leveraged by many investors and traders: fundamental analysis and technical analysis, both useful in achieving different financial objectives with our investments.
In general, fundamental analysis is more useful in long-term investment situations, while technical analysis is more often used in short- and medium-term trading.
By following this guide, you should be able to understand the logic behind both technical and fundamental analysis and properly use them to aid your investment decisions.
Price Earnings Ratio vs. Price Sales Ratio
For much of the late 1990s, the Price/Sales ratio was more important than the Price/Earnings ratio. Therefore, you needed to know the price/sales ratio of every stock you owned by heart. Though the market is not always willing to focus on sales over earnings, it still happens when new companies have not yet achieved profitability. When that's the case, the P/S ratio is the best single indicator of what the market expects from the stock.
The End of Price/Earnings
Every now and then we get an email with a question like this:
How can anyone justify paying a P/E of 400 for XYZ?
It's a valid question. But the real answer is that, for most stocks with incredibly high price/earnings ratios (or no P/E ratios), no one is really looking at earnings.
They are looking at the promise of future earnings. And the promise of future earnings comes from high revenue growth curves with a scalable business model that produces higher earnings in the future.
So, any company with a proven high revenue growth curve, and a scalable business model, can be expected to have strong future earnings. Therefore, paying more on a price/earnings ratio basis is worth it.
That is how stocks get P/Es of 400. The current P/E ratio, however, is meaningless in this line of thinking.
It is far more important to gauge the stock's valuation by the price/sales ratio because all the assumptions of future earnings are based on the revenue projection, not the earnings history.
The price/sales ratio is: Market Capitalization/Trailing Twelve Month Sales
Internet Stocks Started It
Internet stocks first put the price/earnings ratio on the back burner. After all, most IPO’d long before they showed profits. Many never did.
But with the public eager to help finance the future of the Internet, profitability wasn't important. Many were willing to invest in a company on the promise of future earnings.
Anyone who invested in America Online in 1995 or Yahoo in 1996 was initially rewarded for accepting the promise of future earnings, rather than insisting on current earnings.
The appetite for "private venture investing" was so large, that even a company like Sirius Satellite Radio (SIRI) was able to go public without revenues, much less earnings. For Sirius, you couldn't even calculate the price/sales ratio. It was a pure venture investment.
But for companies with existing revenue curves, the price/sales ratio is a measure of what the market expects and is based on the existing revenue history.
Price/Sales Implies Growth
A high price/sales ratio implies a high future revenue growth curve.
Most stocks with high price/sales ratios have at least a few quarters of demonstrated high revenue growth. Based on that proven revenue growth curve, the future revenue growth curve can be projected.
And the higher the future revenue growth curve is, the higher the price/sales ratio that investors are willing to pay.
Price/Sales Ranges
Mature companies of great size ($1 billion or more in sales), that have revenue growth prospects of 5% or so are generally accorded low price/sales ratios of between 2 and 4.
Large technology stocks with larger revenue growth prospects can achieve larger price/sales ratios. Cisco, for example, had a one-year growth rate of 50% in 2000 and a price/sales ratio of 30.
Smaller technology stocks with higher revenue growth prospects can get even higher price/sales ratios.
Monitoring Price/Sales
So, your stock has a high price/sales ratio. What do you do?
If you are a long-term investor, you need to make sure that the price/sales ratio is justified. First, you should examine whether your price/sales ratio is in line with other stocks in the same industry. This can be done by checking the 3-year and 1-year revenue growth curve for companies of a comparable size.
Secondly, because a high price/sales ratio implies strong revenue growth, you need to make sure that revenue growth is continuing to grow.
This is done by calculating not just the revenue growth percentage increases, but the rate of revenue growth.
A decline in the rate of revenue growth is normal as revenue increases. After all, it is harder to grow the larger you get. But there are many small stocks with current increasing revenue growth rates, which implies even higher future revenues. When these stocks show a decline in the rate of revenue growth, the stock can get creamed as the price/sales ratio is knocked down to a lower level.
Price/Sales as a Measure of Risk
Stocks with high price/sales ratios have more risk associated with them.
The reason is simple. The assumption of higher growth, on which the high price/sales ratio is based, is dependent on higher growth happening. When it doesn't, the high price/sales valuation comes down, usually significantly, and the stock price falls, often dramatically.
To fully judge how much risk is in your stock, you need to make a comparison of how your stock compares to other stocks in the same industry, with the same revenue expectations.
A Common Misunderstanding
A high price/sales ratio implies high expectations for revenue growth.
Some readers might infer from that statement that the message was "the higher the Price/Sales ratio, the better," since high revenue growth is a good thing.
Nothing could be further from the truth.
In fact, because a high price/sales ratio implies a high revenue growth curve, any failure to live up to that expectation is severely punished by a drop in valuation.
Anyone investing in a stock with a high price/sales ratio needs to understand that the rate of revenue growth is more important than revenue growth. An unexpected slowdown in the rate of growth will cause a sharp drop in the stock, even if the actual growth is positive.
If you currently own any stocks like this, you should realize that the revenue numbers will be more important than actual earnings numbers.
This becomes especially tricky, because while all these companies have projected earnings numbers, projected revenue numbers from sell-side analysts are not widely publicized.
Revenue, though, will be the first number that money managers look at in these reports, with earnings and margin trends next. A sharp increase in operating margins won't help these stocks if the revenue projections fall far short of expectations.
Technical Analysis Basics
Depending on whom you are talking to, technical analysis can be considered either a very useful tool or voodoo magic. This type of research/analysis is not for all with many preferring a purely fundamental approach. However, as with technical analysis itself, research that encompasses a broader body of complementary work will raise the probability that the investment decision results in profitable returns.
Trends
The objective of technical analysis is not to replace fundamental research. Instead, it is best applied after you have completed your due diligence. This type of analysis can increase your confidence by confirming your fundamental opinion of a stock and help you refine the entry and exit your position.
The first step is always to determine the overall trend of price itself. While this sounds simple, it relies heavily on your timeframe for holding a position. There is the long-term investor (holding for years); a position trader (for several weeks or months); and a short-term trader (focusing on a few days down to intraday). You should focus on the chart lengths that best fit your time horizon and outlook.
Basic methods for determining the underlying trend include drawing simple trendlines and tracking moving averages.
Trendlines are the most basic form of charting and should not be dismissed for their simplicity. A trendline is drawn by either connecting a series of Lower Highs for identifying downtrends or a series of Higher Lows for uptrends.
Short-term traders will want to focus on Daily and intraday prices to stay on the correct side of the trend. Intermediate term traders and long-term investors should benefit following Weekly and Monthly trends.
An alternative to drawing your own trendlines would be applying a moving average to your chart. This indicator provides a visual line of the average price over a specified number of periods. The most popular moving averages used are the 20-, 50-, and 200-day periods. They represent the short, intermediate, and long-term timeframes.
Again, depending on your time horizon to stay in a position, if price is above the moving average, it is considered bullish (going higher). If price is below the moving average, it is deemed bearish (going lower). The shorter the timeframe used, the more signals will be generated, so be sure to choose a length that fits your timeframe to ensure success.
Support and Resistance
These are simply price levels or zones that a stock or index may have trouble penetrating. “Support†is created where the demand overcomes supply for a stock. Or more simply stated, where buyers prove to be more aggressive than sellers around a particular price. Support is usually found along a rising trendline (higher lows), an upsloping moving average, or near a previous low where an advance occurred thereafter.
“Resistance†develops where supply overwhelms demand or when sellers are more aggressive than buyers at a particular price level. It often happens against a falling trendline (lower highs), a down sloping moving average, or near a prior high before prices turned lower.
Breakouts & Breakdowns
In the case of wanting to participate in short-term momentum as price rapidly moves higher or lower, traders will focus on entering orders where buyers overcome a resistance zone or where sellers push through a support zone. These key inflection points that represent a shift in the supply-demand relationship can lead to what is referred to as a “breakout†or “breakdown†of price. Imagine it as price breaking out through a ceiling or breaking down through a floor. It will continue that momentum until it reaches a prior ceiling (resistance) or prior floor (support) on the chart. Or in some cases, the momentum will just start to wane on its own upon extending too far from the breakout/breakdown point.
Pullbacks
When momentum fades, price will often “pull back†into a range where new support and resistance levels are created in context of the prevailing trend. A general rule of thumb is once a breakout over a resistance zone (or ceiling) occurred, then it will now act as a new support (or floor) when prices pullback to it. The logic is that price level is where demand overcame supply and therefore if price trades at that level again, demand will re-enter the market to support it.
It is the opposite when breakdowns occur through a support zone (or floor). That price level should act as new resistance (or ceiling) when price pulls back or rallies into it. This time the assumption is sellers will reappear at that price level where supply had previously surpassed demand.
Technical Indicators and Pattern Analysis
It is highly recommended that anyone using technical analysis in their research and trading first become comfortable with defining the trend and identifying key support and resistance zones. Price itself is what determines whether you have a profit or loss and therefore any indicator or pattern derived from price should be deemed as secondary.
Over time, dedicated “tape readers†began to recognize recurring patterns and shapes appearing on price charts, often before significant moves occurred. There have been numerous books written about these patterns with various names, some more popular and frequent than others. While we cannot go into all of them, understand that you always can categorize them all into three categories - bullish, bearish, and neutral. If this is a path you wish to pursue, realize that trading bullish patterns in uptrends and bearish patterns in downtrends will yield the most success.
With the advent of computers, the ability to produce mathematical lines on price charts became easier than ever. This allowed for programmers to create “indicators†or various plots on a chart that “indicate†how prices are behaving in relation to their past. The indicators can be considered bullish, bearish, or neutral, just how patterns can be categorized. There have been hundreds of indicators developed over the years trying to predict price movement, but the reality is they all remain dependent, and therefore secondary, to interpreting price action itself.
Indicators and pattern analysis can be excellent tools to assist traders in quickly identifying certain market conditions, however, without a solid foundation in analyzing trends and key price levels, one can find themselves getting into trouble frequently. A good comparison to relying too much on indicators is like flying a plane using just the instruments. It can be done, but you probably want to learn to fly without them first.
Money Management
Management of your money can be the difference between long-term success and being forced out of the market. The following are not hard and fast rules, as individuals should tailor to their own needs and preferences, but some consideration needs to be given to these aspects.
The first is the tradable percentage of your total capital. The general guideline here is to invest a maximum of 50% of your capital.
The next question is the size of each individual trade. A range of only 5% to 15% of the total is often given as typical to prevent a situation where one blow up wipes you out.
As far as how much to risk, 5% or less of capital is considered the norm.
Position size and risk tolerance will vary for everyone regardless of capital, so it is critical to have it planned out ahead of time to remain disciplined to it. Most traders and investors start out taking on much bigger size and risk than they should because they focus on the reward instead of the risk. Always keep risk management first to ensure long-term success.
The Big Picture
On the surface, Technical Analysis can seem too simplistic to hold any water against fundamental or economic analysis, however, when it comes time to place your orders at a price you perceive to be over- or under- valued, you are now participating in the supply and demand mechanics of an auction market. Buyers and sellers are constantly leaving footprints behind them on the charts that can be interpreted through various techniques in the field of technical analysis.
Those traders and investors that incorporate price trends along with other forms of analysis can gain a significant edge so long as they remain disciplined to a sound risk management plan that meets their objectives.
Understanding The Price Earnings Ratio
Of all the fundamental statistics available for comparing stocks, the Price/Earnings ratio is the single most widely used. Although all the other ratios involving a stock's price -- Price/Sales, PE/Growth, Price/Book, Price/Cash Flow -- have value, the P/E ratio is the most well-known, most often quoted when only one statistic is given, and serves as an instant reading on the value of a stock.
What Is It?
At first glance, the Price/Earnings ratio seems quite simple. It is calculated, using per share data, as:
CURRENT PRICE / ANNUAL EARNINGS = P/E RATIO
Unfortunately, the P/E statistic is frequently used without clearly defining exactly what is being discussed. Although the math is easy, and the price is usually well-defined, there are options for determining the earnings number, and this is where the most confusion about P/Es occurs.
Types of P/Es
When you see that a stock has "a P/E of 22.0" the first thing you must do is determine what kind of P/E this is. This usually means determining what kind of earnings number is being used. There are several kinds of P/Es:
- Trailing P/E - The earnings are the most recently reported quarter, plus the previous three reported quarters. The abbreviation TTM is often used to indicate Trailing Twelve Months. However, it really means trailing four quarters of reported numbers.
- Forward P/E - The earnings number is the total of estimates for the current unreported quarter and estimates for the following three quarters.
- Fiscal Year P/E - Often you will see P/E as calculated on a particular fiscal year for the company. This may be in a chart or table with P/Es for several future fiscal years shown. When this is done, the current fiscal year may have some actual quarters and some quarters with projections. The future fiscal years are all estimated, of course. If the current fiscal year is not complete, the numbers are usually listed as estimates, even if there is only one quarter unreported.
There are other variations as well. For example, Value Line uses a blended P/E ratio, which they define as the most recent two actual quarters added to the estimates for the upcoming two quarters. Occasionally, you will see the current quarter's estimates combined with the three trailing quarters.
In all these variations, however, the price used is today's price, or at least, the price on or around the time of analysis. Rarely is a future (projected) price used and a historical price is never used. When you see a reference such as "Microsoft never had a P/E higher than 27 in the '80s" the price being referred to is always the price at that time. Generally, in historical reflections, the earnings will be trailing earnings. Occasionally you will see a comparison of today's Forward P/Es with Forward P/Es from the past, but the historical Forward P/E calculations will likely use the actual forward earnings, not the estimates from those times.
Earnings Variations
It is obvious, of course, that estimated earnings will vary by source. However, even actual earnings may vary by source due to calculation methods. While the total earnings of the company are always known, there are two factors to consider in deriving per-share earnings: 1) basic vs. diluted shares; and 2) including or excluding extraordinary charges.
Basic earnings are calculated by taking the total reported earnings of the company and dividing by the number of shares issued currently. Fully diluted earnings are calculated by taking the total reported earnings and dividing by the total of the following: 1) all shares issued; 2) plus all shares subject to warrants; 3) plus all shares subject to convertible bonds. In short, "fully diluted" calculations postulate what would happen if everyone who has a right to a share, exercised that right today. In many cases, for example with options, the holder cannot exercise that right today. However, since many companies continually issue new options and these are converted over time, fully diluted earnings calculations help account for that future dilution.
Basic earnings per share numbers will be higher than fully diluted earnings per-share numbers when earnings are positive. But when a company is losing money, the diluted EPS will be higher as the higher share-count will produce a smaller per share loss. P/Es using basic earnings numbers will therefore be lower than P/Es using fully diluted earnings numbers when a company is profitable (when a company is losing money, a P/E cannot be calculated).
The other calculation affecting earnings is extraordinary charges. Extraordinary charges are expenses that companies classify as non-recurring and are treated as a separate line item on financial reports. These may be costs associated with a layoff or merger, or another one-time event. Generally, most analysts exclude extraordinary charges from earnings calculations. (In fact, Wall Street routinely ignores extraordinary charges altogether even though the expense is real.) If you are making your own P/E calculations from annual reports or from screening databases, you should probably make your calculations using the earnings line which excludes extraordinary charges.
What Good Is It?
Quite simply, the P/E ratio gives you a quick comparison for determining whether a stock is "cheap" or "expensive." Stocks with low P/Es are "cheaper" than stocks with high P/Es. If the stocks are in the same industry, have the same annual earnings, but have different P/Es, the stock with the lower P/E is cheaper. That doesn't mean it is a better buy, as it may have a lower projected growth rate, or some other issue. On the other hand, it might just be cheaper. The P/E ratio is simply a good place to start when making comparisons between stocks.
Comparing P/Es
With all the variations in P/Es, you must make sure you are comparing apples to apples. All companies now use diluted share counts, which helps in calculating P/Es.
During earnings reporting season, you also must make sure that both stocks you are looking at have the same reporting status. With Trailing P/Es, as soon as a stock reports, the new quarter is substituted for the oldest quarter's earnings. If the second stock has not yet reported, its TTM P/E will not reflect the same time period and you should take this into account.
The biggest problem, however, is comparing P/E numbers for stocks when using two different sources. When comparing an analysis from one source with an analysis from another source, you need to check the P/E calculation methods before comparing P/Es. Comparing one stock's Trailing P/E with another's Forward P/E will be misleading.
In researching or analyzing stocks, Briefing.com frequently uses forward P/E's, or fiscal year P/Es, using estimated earnings for the coming year.
Which method is best? Unfortunately, no single method is clearly better than another. Each is useful. Trailing P/Es are solid numbers. Forward P/Es can be misleading if estimates turn out to be wrong. However, Forward P/Es are helpful, especially when paired with the PE/Growth ratio, as this gives a picture of how expensive the stock is relative to its expected future growth. And the future is what the stock market is all about.
Understanding Volume
Volume is an underappreciated statistic. When people ask how the market did today, they rarely ask about volume. Yet volume tells as much about market strength as price movements in the Dow Jones Industrial Average or the Standard & Poor's 500 Index. Volume indicates how meaningful a market movement is.
Large percentage increases accompanied by large volumes are a solid indication of market strength. In contrast, large percentage increases accompanied by small volumes are less likely to indicate a market direction.
Market volume is a relative term and needs to be compared to the average daily volume of the index or stock in question. This number is sometimes difficult to obtain. For example, average daily volume of the Dow Jones Industrial Average is rarely publicized. Nevertheless, it is useful to know the number.
Volume on Individual Stocks
Average daily volume for an individual stock is also a difficult number to obtain sometimes, however it is extremely helpful to have at least a "feel" for the average volume. This will help you make a judgment on how meaningful a large percentage movement in the stock is.
A large percentage price increase accompanied by higher-than-average volume is a strong indicator of future price movements. A large percentage price movement accompanied by lower-than-average volume is a very weak indicator of higher prices persisting.
Similarly, a large downward price movement accompanied by higher-than-average volume is a strong indicator that the stock will continue to move downward (or at least face added pressure in trying to sustain a rebound effort).
Most intriguing of all, however, is higher-than-average volume accompanied by no price movement. This generally indicates something happening behind the scenes, such as a news event or rumor, but the buying is not accompanied by market orders. Determining what is happening when accumulation of this kind occurs can be difficult, but sometimes rewarding.
Thin Volume
On extremely thinly traded stocks, volume is an important indicator of value. For example, there are some investors whose holdings are larger than the average daily volume of a stock. If this is the case, you simply cannot compute your holdings value by multiplying the price times your shares.
Why? You aren't likely to get the current price if you unload it all at one time. When your volume gets close to the daily volume size, your own actions will more than likely affect the price.
In any event, watching volume as well as price is always helpful.
What Are Investment Tactics?
An investment tactic is an actual routine or practice that you follow, in order to make the "buy" decision. It differs from a strategy, which is a broader approach (buy stocks in booming markets, for example.) As an example in a previous Stock Brief, we gave the following:
"Before buying a large stake of 1,000 or more shares in any stock, buy 100 shares. Then follow the stock while researching it, or learning more. Having some money on the line forces you to pay attention."
A number of readers responded that they actually follow this practice, for investment premise purchases. For example, DB99 wrote:
"You are quite right. Have been playing with 500-800K. Used to hold 8-10 Stocks 500 - 1000 Shares / Position, with much Research, and many Watch Lists before buying, switching. Recently have been selecting Sectors and buying 100 Shares each, holding about 30 Stocks, - this is my Watch List - sell the Losers and increase positions on Winners. You have to be IN THE GAME to follow stocks."
But other readers took the opportunity to share their own tactics.
The Expected Rebound
One tactic, submitted by Howard Grunfeld, is to note when a stock hits a new high, then backs off. If it rebounds, which Mr. Grunfeld believes it usually does, it's a good short-term buying signal, as explained below:
"The following tactic has proved successful when the market has been up-trending. If a stock makes a push to a new high (significant move) of 3-4%, and the stocks tends to be volatile, patience has shown me that you can expect a backing of exactly 10% and then if the market is still with you, an immediate bounce off of that point to new highs if the stock is strong or at least 5% in a matter of hours."
Your own results may vary, of course, but this one is certainly "testable."
Combining Technicals with Fundamentals
Another tactic, submitted by MM8006, is based on finding a good stock, on fundamentals, but then waiting for a good technical event to actually make the purchase.
- Find stocks from articles on the Briefing.com site, newspaper, magazines, etc.
- If stock concept (fast growth, growing industry) makes sense, pull research report from [online broker].
- If current ratio, debt/equity, and growth in-line, add to a shopping list on the portfolio screen.
- If news/upgrades make sense, wait for good stochastic.
- When stochastic good (20% or less and rising), price decent, and overall environment OK (Fed not meeting next day), I will buy about $10,000 worth. If the story stays intact, will buy another 10 to 20K worth. I am up about 45% year to date, and 85% year over year. If I could figure out how to sell, I would probably be up almost double.
Buy Them When They're Down
Dan Kucera submitted a variation on the tactic above. He focuses on earnings per share from leading companies as criteria for potential purchases but then waits until the stock falls out of favor.
"I was the first subscriber to the Investor's Business Daily in the state of FL in 1987...They had to mail me the paper as opposed to a.m. delivery... I was a Merrill Lynch broker for 15 years ending in 1999 and now am the portfolio manager for a medium-sized private equity fund."
- Buy Leaders
- Buy the best EPS
- Buy coming out of bases, with volume increases
- Buy when other people don't want them/order imbalances
An order imbalance can be seen with Level II screens (for Nasdaq stocks) and is when sell orders vastly outnumber buy orders, driving the price down. It is roughly equivalent to the basic concept of "buy low."
Insurance
Another tactic, submitted by Tom Quindry, is based on choosing two stocks, then, over time, selling off part of the position in one in order to buy more shares in the other. This is done whenever the faster-rising stock gets far enough ahead to purchase more shares in the slower.
"After I have picked the companies that I will invest in, I pair off stocks that I will focus on. I will buy and sell between pairs of stocks (in IRAs) when I can get more shares of a previously held stock than I sold to get the stock I now have. My strategy is that I don't know which stock will do better, but I do know that both stocks are good. I can use this strategy even if both stocks go down in price."
"As long as I can buy more shares of the previous position without an additional outlay of cash, I sell and then buy the other. This seems to be better than just holding one position since I don't know which stock will gain more in the long run. I hold as long as it takes to get the advantage."
This rebalancing tactic forces the concept of "buy low, sell high" on an ongoing basis.
Know Yourself
Finally, a number of people wrote passionate descriptions on how they learned their particular tactic, and not as much on the tactic itself.
In fact, JSH submitted the following "code" he adopted, after losing nearly all his money in his first six months of trading:
"I wish you to publish this so that NO ONE has to go through the pain that I went through."
Past is experience, learn from it. Do not regret.
Future is mystery, anticipate it. Do not hope.
Present is opportunity, embrace it. Do not fear.
Opportunity is belief, believe it. Do not doubt.
Believe in Yourself. You are the Market.
If I want to be a trader, I must develop courage.
If I want to be a consistent trader, I must develop discipline.
If I change myself from inside to the Market, only then, I will become a great Trader!
Regardless of whether you agree with these particular principles, the important thing to note is that JSH came to grips with his own personal set of principles.
In the end, this is the strongest and best investing tactic of all: know yourself. Most investing mistakes come from taking positions you don't actually understand, or which make you extremely uncomfortable.
When you find a way to trust your own judgments, you have found the best tactic of all.
What Are Technical Trading Tactics?
Technical analysis (TA) is the study of price action itself presented in a chart format. Although the basic assumption of future price movements being dependent on past price movement is never certain, many traders use TA as their primary means of making tactical buy and sell decisions.
Using Daily Moving Average
The daily moving average is a popular technical indicator. Since it represents a “rolling†average of price over a specific period, traders can apply various tactics to them.
Most traders use moving averages as a visual way to identify the trend. If it is trending higher, they focus on buying. If it is trending lower, they focus on selling.
Short-term traders will use shorter periods to generate more frequent trading signals. The goal here is to make many small profits that will accumulate into larger gains overtime.
Longer-term traders will prefer longer periods to stay in trends for longer durations. Their objective is to make fewer trades and ride out the trends for bigger gains.
Of course, neither of these will work without a sound money and risk management plan to keep losses under control.
Some traders use moving averages as a mean reversion trade. In other words, if price extends too far up or down away from its average price, the assumption is price will start to retrace back to the average.
While this approach to trading can be very profitable, it is best suited for more experienced traders with a strong discipline in place to keep risk under control as they bet against the trend.
The most popular moving averages are the 20, 50, and 200-day periods. As a general guideline, traders want to be Long when price is above all three and the 20-day is trending up over the 50-day, and the 50-day is trending above the 200-day. Vice versa for Short positions.
Some traders will adjust their position size based on where price lies in relation to the moving averages. If price slides between the 20-day and 50-day moving averages, position size is reduced to half. If it falls between the 50-day and 200-day, the position is reduced to a quarter. Below the 200-day ma, the position is exited.
Broken Trendlines
Another popular technical analysis method is to look for broken trendlines to identify a change in the trend.
The assumption is the prevailing buyers or sellers that created the trend have exhausted their positions and allowed for a shift in the supply-demand relationship. Downtrends will be broken with a rise in price making a series of Higher Highs. Uptrends will be broken with a drop in price making a series of Lower Lows.
If you can develop a reliable method of determining when a trend has truly been broken, this tactic can be very effective. Some general tips to consider include:
- Make sure volume spikes above average upon breaking through a trendline. The more volume the better as it suggests a significant shift in ownership is happening.
- Support/Resistance Levels. The common saying is “old support becomes new resistance; and old resistance becomes new support.†It is not uncommon to see a mild pullback pattern develop after a broken trendline occurs on heavy volume. Monitor prior support and resistance for potential low-risk entry points.
- Multiple Timeframe Analysis. Most traders don’t rely on just one chart to make their decisions. By analyzing both the short- and long-term charts, traders can make a better determination of whether the trend is changing or not. The more timeframes that show a change in trend, the stronger that change is.
Short-Term MA Crossing Long-Term MA
Another technical trading tactic is looking at moving averages of differing duration and deciding to buy or sell based upon the interaction of the two lines.
When the shorter of the two averages moves above the longer one, a buy signal is generated. A sell signal triggers when the opposite happens.
While this is an excellent way of making sure to be trading with the trend, realize that the different in length of the moving averages can have a significant impact on trade results due to the lag. For less lag and more momentum, the intervals should be closer together. The wider apart they are, the more likely price is already extended away from their means and likely to reverse by the time the crossover occurs.
For example, by the time a 20-day and 50-day ma crossover, price could be ready to reverse if it is extended too far from their intersection. However, a 10-day and a 5-day ma are more likely to be in the middle of a momentum change to jump aboard the trend.
Summary
In this article, we barely scratched the surface of the numerous ways to trade using technical analysis. However, the key to success with any trading approach will always come down to being disciplined to a plan and proper risk management once in the trade.
No approach to trading is going to work 100% of the time. In fact, most traders should assume a 50/50 probability on all their trades, therefore recognizing the only way to be successful is to consistently maximize their winners and keep their losses small.
How to Quickly Analyze a Company’s Earnings Report

Earnings season can feel overwhelming. Every few months, companies release thick reports filled with tables, charts, and financial jargon. But here’s the secret: you don’t have to read every page to know whether a company is performing well.
With a little practice, you can scan the most important numbers and get a clear picture of a business in just a few minutes. Here’s how.
Step 1: Start With the Headline Numbers
The first place to look is the top line (revenue)Â and the bottom line (earnings per share, or EPS).
Revenue (sales):Â Did the company sell more than last year? Did it beat Wall Street expectations?
Technical analysis and fundamental analysis are two primary methods used to research stocks and make investment-related decisions.
EPS (earnings per share):Â How much profit does each share of stock represent? Was it higher or lower than analysts predicted?
Step 2: Check Profit Margins
Sales don’t tell the whole story. Margins reveal how efficiently a company turns sales into profits.
Gross Margin:Â Profit after making the product or service.
Operating Margin:Â Profit after day-to-day business costs.
Net Margin: Profit after everything—taxes, interest, etc.
Rising margins = stronger efficiency. Shrinking margins = possible cost or pricing problems.
Step 3: Look at the Guidance
Earnings reports aren’t just about what happened—they also include what management expects next. This is called guidance.
Raised guidance:Â Management sees better results ahead.
Cut guidance:Â Management is warning about slower growth.
Why it matters:Â The market is forward-looking. Often, future guidance moves the stock more than past results.
Step 4: Follow the Cash
Cash is the lifeblood of a company. Even profitable businesses can run into trouble if they don’t generate enough cash. Look for:
Operating Cash Flow / Free Cash Flow:Â Is the company generating real cash after expenses?
Debt Levels:Â Is debt climbing faster than cash reserves?
Strong cash flow = financial flexibility. High debt = risk if conditions worsen.
Step 5: Listen to the Earnings Call
After the report, management usually hosts an earnings call. This gives investors context around the numbers.
What challenges are they facing (costs, competition, demand)?
Where are they seeing growth (new products, technology, global expansion)?
How do they view the economy overall?
Quick Investor Shortcut
If you only have a few minutes, here’s your three-step scan:
1. Revenue & EPS vs. expectations: Did the company beat or miss?
2. Guidance: Is the outlook stronger or weaker?
3. Margins: Are profits improving or under pressure?
Final Takeaway
Earnings reports don’t need to be intimidating. By focusing on revenue, earnings, margins, guidance, and cash flow, you can quickly separate strong performers from struggling companies. Everything else is just detail.
The more you practice, the faster this becomes—eventually, you’ll be able to size up a report in just a few minutes, just like the pros.
Go Beyond the Earnings Report
Remember: a single earnings report is just one piece of the puzzle. It’s always a good idea to do as much research as possible before buying a stock.
When you have more time to dig deeper, check out our step-by-step guide on How to Analyze Stocks. It walks you through valuation, competitive advantages, and other important metrics that matter just as much as quarterly results.
Price Earnings Ratio vs. Price Sales Ratio
For much of the late 1990s, the Price/Sales ratio was more important than the Price/Earnings ratio. Therefore, you needed to know the price/sales ratio of every stock you owned by heart. Though the market is not always willing to focus on sales over earnings, it still happens when new companies have not yet achieved profitability. When that's the case, the P/S ratio is the best single indicator of what the market expects from the stock.
The End of Price/Earnings
Every now and then we get an email with a question like this:
How can anyone justify paying a P/E of 400 for XYZ?
It's a valid question. But the real answer is that, for most stocks with incredibly high price/earnings ratios (or no P/E ratios), no one is really looking at earnings.
They are looking at the promise of future earnings. And the promise of future earnings comes from high revenue growth curves with a scalable business model that produces higher earnings in the future.
So, any company with a proven high revenue growth curve, and a scalable business model, can be expected to have strong future earnings. Therefore, paying more on a price/earnings ratio basis is worth it.
That is how stocks get P/Es of 400. The current P/E ratio, however, is meaningless in this line of thinking.
It is far more important to gauge the stock's valuation by the price/sales ratio because all the assumptions of future earnings are based on the revenue projection, not the earnings history.
The price/sales ratio is: Market Capitalization/Trailing Twelve Month Sales
Internet Stocks Started It
Internet stocks first put the price/earnings ratio on the back burner. After all, most IPO’d long before they showed profits. Many never did.
But with the public eager to help finance the future of the Internet, profitability wasn't important. Many were willing to invest in a company on the promise of future earnings.
Anyone who invested in America Online in 1995 or Yahoo in 1996 was initially rewarded for accepting the promise of future earnings, rather than insisting on current earnings.
The appetite for "private venture investing" was so large, that even a company like Sirius Satellite Radio (SIRI) was able to go public without revenues, much less earnings. For Sirius, you couldn't even calculate the price/sales ratio. It was a pure venture investment.
But for companies with existing revenue curves, the price/sales ratio is a measure of what the market expects and is based on the existing revenue history.
Price/Sales Implies Growth
A high price/sales ratio implies a high future revenue growth curve.
Most stocks with high price/sales ratios have at least a few quarters of demonstrated high revenue growth. Based on that proven revenue growth curve, the future revenue growth curve can be projected.
And the higher the future revenue growth curve is, the higher the price/sales ratio that investors are willing to pay.
Price/Sales Ranges
Mature companies of great size ($1 billion or more in sales), that have revenue growth prospects of 5% or so are generally accorded low price/sales ratios of between 2 and 4.
Large technology stocks with larger revenue growth prospects can achieve larger price/sales ratios. Cisco, for example, had a one-year growth rate of 50% in 2000 and a price/sales ratio of 30.
Smaller technology stocks with higher revenue growth prospects can get even higher price/sales ratios.
Monitoring Price/Sales
So, your stock has a high price/sales ratio. What do you do?
If you are a long-term investor, you need to make sure that the price/sales ratio is justified. First, you should examine whether your price/sales ratio is in line with other stocks in the same industry. This can be done by checking the 3-year and 1-year revenue growth curve for companies of a comparable size.
Secondly, because a high price/sales ratio implies strong revenue growth, you need to make sure that revenue growth is continuing to grow.
This is done by calculating not just the revenue growth percentage increases, but the rate of revenue growth.
A decline in the rate of revenue growth is normal as revenue increases. After all, it is harder to grow the larger you get. But there are many small stocks with current increasing revenue growth rates, which implies even higher future revenues. When these stocks show a decline in the rate of revenue growth, the stock can get creamed as the price/sales ratio is knocked down to a lower level.
Price/Sales as a Measure of Risk
Stocks with high price/sales ratios have more risk associated with them.
The reason is simple. The assumption of higher growth, on which the high price/sales ratio is based, is dependent on higher growth happening. When it doesn't, the high price/sales valuation comes down, usually significantly, and the stock price falls, often dramatically.
To fully judge how much risk is in your stock, you need to make a comparison of how your stock compares to other stocks in the same industry, with the same revenue expectations.
A Common Misunderstanding
A high price/sales ratio implies high expectations for revenue growth.
Some readers might infer from that statement that the message was "the higher the Price/Sales ratio, the better," since high revenue growth is a good thing.
Nothing could be further from the truth.
In fact, because a high price/sales ratio implies a high revenue growth curve, any failure to live up to that expectation is severely punished by a drop in valuation.
Anyone investing in a stock with a high price/sales ratio needs to understand that the rate of revenue growth is more important than revenue growth. An unexpected slowdown in the rate of growth will cause a sharp drop in the stock, even if the actual growth is positive.
If you currently own any stocks like this, you should realize that the revenue numbers will be more important than actual earnings numbers.
This becomes especially tricky, because while all these companies have projected earnings numbers, projected revenue numbers from sell-side analysts are not widely publicized.
Revenue, though, will be the first number that money managers look at in these reports, with earnings and margin trends next. A sharp increase in operating margins won't help these stocks if the revenue projections fall far short of expectations.
Technical Analysis Basics
Depending on whom you are talking to, technical analysis can be considered either a very useful tool or voodoo magic. This type of research/analysis is not for all with many preferring a purely fundamental approach. However, as with technical analysis itself, research that encompasses a broader body of complementary work will raise the probability that the investment decision results in profitable returns.
Trends
The objective of technical analysis is not to replace fundamental research. Instead, it is best applied after you have completed your due diligence. This type of analysis can increase your confidence by confirming your fundamental opinion of a stock and help you refine the entry and exit your position.
The first step is always to determine the overall trend of price itself. While this sounds simple, it relies heavily on your timeframe for holding a position. There is the long-term investor (holding for years); a position trader (for several weeks or months); and a short-term trader (focusing on a few days down to intraday). You should focus on the chart lengths that best fit your time horizon and outlook.
Basic methods for determining the underlying trend include drawing simple trendlines and tracking moving averages.
Trendlines are the most basic form of charting and should not be dismissed for their simplicity. A trendline is drawn by either connecting a series of Lower Highs for identifying downtrends or a series of Higher Lows for uptrends.
Short-term traders will want to focus on Daily and intraday prices to stay on the correct side of the trend. Intermediate term traders and long-term investors should benefit following Weekly and Monthly trends.
An alternative to drawing your own trendlines would be applying a moving average to your chart. This indicator provides a visual line of the average price over a specified number of periods. The most popular moving averages used are the 20-, 50-, and 200-day periods. They represent the short, intermediate, and long-term timeframes.
Again, depending on your time horizon to stay in a position, if price is above the moving average, it is considered bullish (going higher). If price is below the moving average, it is deemed bearish (going lower). The shorter the timeframe used, the more signals will be generated, so be sure to choose a length that fits your timeframe to ensure success.
Support and Resistance
These are simply price levels or zones that a stock or index may have trouble penetrating. “Support†is created where the demand overcomes supply for a stock. Or more simply stated, where buyers prove to be more aggressive than sellers around a particular price. Support is usually found along a rising trendline (higher lows), an upsloping moving average, or near a previous low where an advance occurred thereafter.
“Resistance†develops where supply overwhelms demand or when sellers are more aggressive than buyers at a particular price level. It often happens against a falling trendline (lower highs), a down sloping moving average, or near a prior high before prices turned lower.
Breakouts & Breakdowns
In the case of wanting to participate in short-term momentum as price rapidly moves higher or lower, traders will focus on entering orders where buyers overcome a resistance zone or where sellers push through a support zone. These key inflection points that represent a shift in the supply-demand relationship can lead to what is referred to as a “breakout†or “breakdown†of price. Imagine it as price breaking out through a ceiling or breaking down through a floor. It will continue that momentum until it reaches a prior ceiling (resistance) or prior floor (support) on the chart. Or in some cases, the momentum will just start to wane on its own upon extending too far from the breakout/breakdown point.
Pullbacks
When momentum fades, price will often “pull back†into a range where new support and resistance levels are created in context of the prevailing trend. A general rule of thumb is once a breakout over a resistance zone (or ceiling) occurred, then it will now act as a new support (or floor) when prices pullback to it. The logic is that price level is where demand overcame supply and therefore if price trades at that level again, demand will re-enter the market to support it.
It is the opposite when breakdowns occur through a support zone (or floor). That price level should act as new resistance (or ceiling) when price pulls back or rallies into it. This time the assumption is sellers will reappear at that price level where supply had previously surpassed demand.
Technical Indicators and Pattern Analysis
It is highly recommended that anyone using technical analysis in their research and trading first become comfortable with defining the trend and identifying key support and resistance zones. Price itself is what determines whether you have a profit or loss and therefore any indicator or pattern derived from price should be deemed as secondary.
Over time, dedicated “tape readers†began to recognize recurring patterns and shapes appearing on price charts, often before significant moves occurred. There have been numerous books written about these patterns with various names, some more popular and frequent than others. While we cannot go into all of them, understand that you always can categorize them all into three categories - bullish, bearish, and neutral. If this is a path you wish to pursue, realize that trading bullish patterns in uptrends and bearish patterns in downtrends will yield the most success.
With the advent of computers, the ability to produce mathematical lines on price charts became easier than ever. This allowed for programmers to create “indicators†or various plots on a chart that “indicate†how prices are behaving in relation to their past. The indicators can be considered bullish, bearish, or neutral, just how patterns can be categorized. There have been hundreds of indicators developed over the years trying to predict price movement, but the reality is they all remain dependent, and therefore secondary, to interpreting price action itself.
Indicators and pattern analysis can be excellent tools to assist traders in quickly identifying certain market conditions, however, without a solid foundation in analyzing trends and key price levels, one can find themselves getting into trouble frequently. A good comparison to relying too much on indicators is like flying a plane using just the instruments. It can be done, but you probably want to learn to fly without them first.
Money Management
Management of your money can be the difference between long-term success and being forced out of the market. The following are not hard and fast rules, as individuals should tailor to their own needs and preferences, but some consideration needs to be given to these aspects.
The first is the tradable percentage of your total capital. The general guideline here is to invest a maximum of 50% of your capital.
The next question is the size of each individual trade. A range of only 5% to 15% of the total is often given as typical to prevent a situation where one blow up wipes you out.
As far as how much to risk, 5% or less of capital is considered the norm.
Position size and risk tolerance will vary for everyone regardless of capital, so it is critical to have it planned out ahead of time to remain disciplined to it. Most traders and investors start out taking on much bigger size and risk than they should because they focus on the reward instead of the risk. Always keep risk management first to ensure long-term success.
The Big Picture
On the surface, Technical Analysis can seem too simplistic to hold any water against fundamental or economic analysis, however, when it comes time to place your orders at a price you perceive to be over- or under- valued, you are now participating in the supply and demand mechanics of an auction market. Buyers and sellers are constantly leaving footprints behind them on the charts that can be interpreted through various techniques in the field of technical analysis.
Those traders and investors that incorporate price trends along with other forms of analysis can gain a significant edge so long as they remain disciplined to a sound risk management plan that meets their objectives.
Understanding The Price Earnings Ratio
Of all the fundamental statistics available for comparing stocks, the Price/Earnings ratio is the single most widely used. Although all the other ratios involving a stock's price -- Price/Sales, PE/Growth, Price/Book, Price/Cash Flow -- have value, the P/E ratio is the most well-known, most often quoted when only one statistic is given, and serves as an instant reading on the value of a stock.
What Is It?
At first glance, the Price/Earnings ratio seems quite simple. It is calculated, using per share data, as:
CURRENT PRICE / ANNUAL EARNINGS = P/E RATIO
Unfortunately, the P/E statistic is frequently used without clearly defining exactly what is being discussed. Although the math is easy, and the price is usually well-defined, there are options for determining the earnings number, and this is where the most confusion about P/Es occurs.
Types of P/Es
When you see that a stock has "a P/E of 22.0" the first thing you must do is determine what kind of P/E this is. This usually means determining what kind of earnings number is being used. There are several kinds of P/Es:
- Trailing P/E - The earnings are the most recently reported quarter, plus the previous three reported quarters. The abbreviation TTM is often used to indicate Trailing Twelve Months. However, it really means trailing four quarters of reported numbers.
- Forward P/E - The earnings number is the total of estimates for the current unreported quarter and estimates for the following three quarters.
- Fiscal Year P/E - Often you will see P/E as calculated on a particular fiscal year for the company. This may be in a chart or table with P/Es for several future fiscal years shown. When this is done, the current fiscal year may have some actual quarters and some quarters with projections. The future fiscal years are all estimated, of course. If the current fiscal year is not complete, the numbers are usually listed as estimates, even if there is only one quarter unreported.
There are other variations as well. For example, Value Line uses a blended P/E ratio, which they define as the most recent two actual quarters added to the estimates for the upcoming two quarters. Occasionally, you will see the current quarter's estimates combined with the three trailing quarters.
In all these variations, however, the price used is today's price, or at least, the price on or around the time of analysis. Rarely is a future (projected) price used and a historical price is never used. When you see a reference such as "Microsoft never had a P/E higher than 27 in the '80s" the price being referred to is always the price at that time. Generally, in historical reflections, the earnings will be trailing earnings. Occasionally you will see a comparison of today's Forward P/Es with Forward P/Es from the past, but the historical Forward P/E calculations will likely use the actual forward earnings, not the estimates from those times.
Earnings Variations
It is obvious, of course, that estimated earnings will vary by source. However, even actual earnings may vary by source due to calculation methods. While the total earnings of the company are always known, there are two factors to consider in deriving per-share earnings: 1) basic vs. diluted shares; and 2) including or excluding extraordinary charges.
Basic earnings are calculated by taking the total reported earnings of the company and dividing by the number of shares issued currently. Fully diluted earnings are calculated by taking the total reported earnings and dividing by the total of the following: 1) all shares issued; 2) plus all shares subject to warrants; 3) plus all shares subject to convertible bonds. In short, "fully diluted" calculations postulate what would happen if everyone who has a right to a share, exercised that right today. In many cases, for example with options, the holder cannot exercise that right today. However, since many companies continually issue new options and these are converted over time, fully diluted earnings calculations help account for that future dilution.
Basic earnings per share numbers will be higher than fully diluted earnings per-share numbers when earnings are positive. But when a company is losing money, the diluted EPS will be higher as the higher share-count will produce a smaller per share loss. P/Es using basic earnings numbers will therefore be lower than P/Es using fully diluted earnings numbers when a company is profitable (when a company is losing money, a P/E cannot be calculated).
The other calculation affecting earnings is extraordinary charges. Extraordinary charges are expenses that companies classify as non-recurring and are treated as a separate line item on financial reports. These may be costs associated with a layoff or merger, or another one-time event. Generally, most analysts exclude extraordinary charges from earnings calculations. (In fact, Wall Street routinely ignores extraordinary charges altogether even though the expense is real.) If you are making your own P/E calculations from annual reports or from screening databases, you should probably make your calculations using the earnings line which excludes extraordinary charges.
What Good Is It?
Quite simply, the P/E ratio gives you a quick comparison for determining whether a stock is "cheap" or "expensive." Stocks with low P/Es are "cheaper" than stocks with high P/Es. If the stocks are in the same industry, have the same annual earnings, but have different P/Es, the stock with the lower P/E is cheaper. That doesn't mean it is a better buy, as it may have a lower projected growth rate, or some other issue. On the other hand, it might just be cheaper. The P/E ratio is simply a good place to start when making comparisons between stocks.
Comparing P/Es
With all the variations in P/Es, you must make sure you are comparing apples to apples. All companies now use diluted share counts, which helps in calculating P/Es.
During earnings reporting season, you also must make sure that both stocks you are looking at have the same reporting status. With Trailing P/Es, as soon as a stock reports, the new quarter is substituted for the oldest quarter's earnings. If the second stock has not yet reported, its TTM P/E will not reflect the same time period and you should take this into account.
The biggest problem, however, is comparing P/E numbers for stocks when using two different sources. When comparing an analysis from one source with an analysis from another source, you need to check the P/E calculation methods before comparing P/Es. Comparing one stock's Trailing P/E with another's Forward P/E will be misleading.
In researching or analyzing stocks, Briefing.com frequently uses forward P/E's, or fiscal year P/Es, using estimated earnings for the coming year.
Which method is best? Unfortunately, no single method is clearly better than another. Each is useful. Trailing P/Es are solid numbers. Forward P/Es can be misleading if estimates turn out to be wrong. However, Forward P/Es are helpful, especially when paired with the PE/Growth ratio, as this gives a picture of how expensive the stock is relative to its expected future growth. And the future is what the stock market is all about.
Understanding Volume
Volume is an underappreciated statistic. When people ask how the market did today, they rarely ask about volume. Yet volume tells as much about market strength as price movements in the Dow Jones Industrial Average or the Standard & Poor's 500 Index. Volume indicates how meaningful a market movement is.
Large percentage increases accompanied by large volumes are a solid indication of market strength. In contrast, large percentage increases accompanied by small volumes are less likely to indicate a market direction.
Market volume is a relative term and needs to be compared to the average daily volume of the index or stock in question. This number is sometimes difficult to obtain. For example, average daily volume of the Dow Jones Industrial Average is rarely publicized. Nevertheless, it is useful to know the number.
Volume on Individual Stocks
Average daily volume for an individual stock is also a difficult number to obtain sometimes, however it is extremely helpful to have at least a "feel" for the average volume. This will help you make a judgment on how meaningful a large percentage movement in the stock is.
A large percentage price increase accompanied by higher-than-average volume is a strong indicator of future price movements. A large percentage price movement accompanied by lower-than-average volume is a very weak indicator of higher prices persisting.
Similarly, a large downward price movement accompanied by higher-than-average volume is a strong indicator that the stock will continue to move downward (or at least face added pressure in trying to sustain a rebound effort).
Most intriguing of all, however, is higher-than-average volume accompanied by no price movement. This generally indicates something happening behind the scenes, such as a news event or rumor, but the buying is not accompanied by market orders. Determining what is happening when accumulation of this kind occurs can be difficult, but sometimes rewarding.
Thin Volume
On extremely thinly traded stocks, volume is an important indicator of value. For example, there are some investors whose holdings are larger than the average daily volume of a stock. If this is the case, you simply cannot compute your holdings value by multiplying the price times your shares.
Why? You aren't likely to get the current price if you unload it all at one time. When your volume gets close to the daily volume size, your own actions will more than likely affect the price.
In any event, watching volume as well as price is always helpful.
What Are Investment Tactics?
An investment tactic is an actual routine or practice that you follow, in order to make the "buy" decision. It differs from a strategy, which is a broader approach (buy stocks in booming markets, for example.) As an example in a previous Stock Brief, we gave the following:
"Before buying a large stake of 1,000 or more shares in any stock, buy 100 shares. Then follow the stock while researching it, or learning more. Having some money on the line forces you to pay attention."
A number of readers responded that they actually follow this practice, for investment premise purchases. For example, DB99 wrote:
"You are quite right. Have been playing with 500-800K. Used to hold 8-10 Stocks 500 - 1000 Shares / Position, with much Research, and many Watch Lists before buying, switching. Recently have been selecting Sectors and buying 100 Shares each, holding about 30 Stocks, - this is my Watch List - sell the Losers and increase positions on Winners. You have to be IN THE GAME to follow stocks."
But other readers took the opportunity to share their own tactics.
The Expected Rebound
One tactic, submitted by Howard Grunfeld, is to note when a stock hits a new high, then backs off. If it rebounds, which Mr. Grunfeld believes it usually does, it's a good short-term buying signal, as explained below:
"The following tactic has proved successful when the market has been up-trending. If a stock makes a push to a new high (significant move) of 3-4%, and the stocks tends to be volatile, patience has shown me that you can expect a backing of exactly 10% and then if the market is still with you, an immediate bounce off of that point to new highs if the stock is strong or at least 5% in a matter of hours."
Your own results may vary, of course, but this one is certainly "testable."
Combining Technicals with Fundamentals
Another tactic, submitted by MM8006, is based on finding a good stock, on fundamentals, but then waiting for a good technical event to actually make the purchase.
- Find stocks from articles on the Briefing.com site, newspaper, magazines, etc.
- If stock concept (fast growth, growing industry) makes sense, pull research report from [online broker].
- If current ratio, debt/equity, and growth in-line, add to a shopping list on the portfolio screen.
- If news/upgrades make sense, wait for good stochastic.
- When stochastic good (20% or less and rising), price decent, and overall environment OK (Fed not meeting next day), I will buy about $10,000 worth. If the story stays intact, will buy another 10 to 20K worth. I am up about 45% year to date, and 85% year over year. If I could figure out how to sell, I would probably be up almost double.
Buy Them When They're Down
Dan Kucera submitted a variation on the tactic above. He focuses on earnings per share from leading companies as criteria for potential purchases but then waits until the stock falls out of favor.
"I was the first subscriber to the Investor's Business Daily in the state of FL in 1987...They had to mail me the paper as opposed to a.m. delivery... I was a Merrill Lynch broker for 15 years ending in 1999 and now am the portfolio manager for a medium-sized private equity fund."
- Buy Leaders
- Buy the best EPS
- Buy coming out of bases, with volume increases
- Buy when other people don't want them/order imbalances
An order imbalance can be seen with Level II screens (for Nasdaq stocks) and is when sell orders vastly outnumber buy orders, driving the price down. It is roughly equivalent to the basic concept of "buy low."
Insurance
Another tactic, submitted by Tom Quindry, is based on choosing two stocks, then, over time, selling off part of the position in one in order to buy more shares in the other. This is done whenever the faster-rising stock gets far enough ahead to purchase more shares in the slower.
"After I have picked the companies that I will invest in, I pair off stocks that I will focus on. I will buy and sell between pairs of stocks (in IRAs) when I can get more shares of a previously held stock than I sold to get the stock I now have. My strategy is that I don't know which stock will do better, but I do know that both stocks are good. I can use this strategy even if both stocks go down in price."
"As long as I can buy more shares of the previous position without an additional outlay of cash, I sell and then buy the other. This seems to be better than just holding one position since I don't know which stock will gain more in the long run. I hold as long as it takes to get the advantage."
This rebalancing tactic forces the concept of "buy low, sell high" on an ongoing basis.
Know Yourself
Finally, a number of people wrote passionate descriptions on how they learned their particular tactic, and not as much on the tactic itself.
In fact, JSH submitted the following "code" he adopted, after losing nearly all his money in his first six months of trading:
"I wish you to publish this so that NO ONE has to go through the pain that I went through."
Past is experience, learn from it. Do not regret.
Future is mystery, anticipate it. Do not hope.
Present is opportunity, embrace it. Do not fear.
Opportunity is belief, believe it. Do not doubt.
Believe in Yourself. You are the Market.
If I want to be a trader, I must develop courage.
If I want to be a consistent trader, I must develop discipline.
If I change myself from inside to the Market, only then, I will become a great Trader!
Regardless of whether you agree with these particular principles, the important thing to note is that JSH came to grips with his own personal set of principles.
In the end, this is the strongest and best investing tactic of all: know yourself. Most investing mistakes come from taking positions you don't actually understand, or which make you extremely uncomfortable.
When you find a way to trust your own judgments, you have found the best tactic of all.
What Are Technical Trading Tactics?
Technical analysis (TA) is the study of price action itself presented in a chart format. Although the basic assumption of future price movements being dependent on past price movement is never certain, many traders use TA as their primary means of making tactical buy and sell decisions.
Using Daily Moving Average
The daily moving average is a popular technical indicator. Since it represents a “rolling†average of price over a specific period, traders can apply various tactics to them.
Most traders use moving averages as a visual way to identify the trend. If it is trending higher, they focus on buying. If it is trending lower, they focus on selling.
Short-term traders will use shorter periods to generate more frequent trading signals. The goal here is to make many small profits that will accumulate into larger gains overtime.
Longer-term traders will prefer longer periods to stay in trends for longer durations. Their objective is to make fewer trades and ride out the trends for bigger gains.
Of course, neither of these will work without a sound money and risk management plan to keep losses under control.
Some traders use moving averages as a mean reversion trade. In other words, if price extends too far up or down away from its average price, the assumption is price will start to retrace back to the average.
While this approach to trading can be very profitable, it is best suited for more experienced traders with a strong discipline in place to keep risk under control as they bet against the trend.
The most popular moving averages are the 20, 50, and 200-day periods. As a general guideline, traders want to be Long when price is above all three and the 20-day is trending up over the 50-day, and the 50-day is trending above the 200-day. Vice versa for Short positions.
Some traders will adjust their position size based on where price lies in relation to the moving averages. If price slides between the 20-day and 50-day moving averages, position size is reduced to half. If it falls between the 50-day and 200-day, the position is reduced to a quarter. Below the 200-day ma, the position is exited.
Broken Trendlines
Another popular technical analysis method is to look for broken trendlines to identify a change in the trend.
The assumption is the prevailing buyers or sellers that created the trend have exhausted their positions and allowed for a shift in the supply-demand relationship. Downtrends will be broken with a rise in price making a series of Higher Highs. Uptrends will be broken with a drop in price making a series of Lower Lows.
If you can develop a reliable method of determining when a trend has truly been broken, this tactic can be very effective. Some general tips to consider include:
- Make sure volume spikes above average upon breaking through a trendline. The more volume the better as it suggests a significant shift in ownership is happening.
- Support/Resistance Levels. The common saying is “old support becomes new resistance; and old resistance becomes new support.†It is not uncommon to see a mild pullback pattern develop after a broken trendline occurs on heavy volume. Monitor prior support and resistance for potential low-risk entry points.
- Multiple Timeframe Analysis. Most traders don’t rely on just one chart to make their decisions. By analyzing both the short- and long-term charts, traders can make a better determination of whether the trend is changing or not. The more timeframes that show a change in trend, the stronger that change is.
Short-Term MA Crossing Long-Term MA
Another technical trading tactic is looking at moving averages of differing duration and deciding to buy or sell based upon the interaction of the two lines.
When the shorter of the two averages moves above the longer one, a buy signal is generated. A sell signal triggers when the opposite happens.
While this is an excellent way of making sure to be trading with the trend, realize that the different in length of the moving averages can have a significant impact on trade results due to the lag. For less lag and more momentum, the intervals should be closer together. The wider apart they are, the more likely price is already extended away from their means and likely to reverse by the time the crossover occurs.
For example, by the time a 20-day and 50-day ma crossover, price could be ready to reverse if it is extended too far from their intersection. However, a 10-day and a 5-day ma are more likely to be in the middle of a momentum change to jump aboard the trend.
Summary
In this article, we barely scratched the surface of the numerous ways to trade using technical analysis. However, the key to success with any trading approach will always come down to being disciplined to a plan and proper risk management once in the trade.
No approach to trading is going to work 100% of the time. In fact, most traders should assume a 50/50 probability on all their trades, therefore recognizing the only way to be successful is to consistently maximize their winners and keep their losses small.
Basic Trading Rules
The whole goal in trading/investing is to make money. To get there, not only do we have to generate good, well-researched, trading/investing ideas, we must keep a level head when it comes to the actual trading/investing part. No matter how good a trader is, the psychological part of trading can get to any of us.
However, if we can do our best in keeping some basic rules in place with our trading/investing strategy, the smoother the whole process should be.
So, before getting into a trade…
#1: Is the trade you’re taking a non-speculative or speculative trade?
Non-speculative trades are those of companies that are typically of higher quality, so the stock generally trades with less volatility, in a somewhat more controlled way, and is viewed as a trade that has lower risk vs. speculative trades.
Speculative companies are typically lower-quality companies, but not always necessarily. I must stress things like this because we must be careful to not apply absolutes in areas of the market where they do not exist.
As an example, Microsoft (MSFT) is a trade that would be considered a non-speculative trade.
Meanwhile, a nano-cap oil and gas stocks such as KLX Energy Services (KLXE), for example, would be known as a speculative trade. Non-speculative vs. speculative:
- Less risk vs. more risk
- Less stock volatility vs. more volatility
#2: Know a stock’s market cap, average trading volume, average true range (ATR) and its beta.
The market cap will give you an idea of its size (i.e., mega-cap, large-cap, mid-cap, small-cap, micro-cap, or nano-cap) and its average volume, average true range and its beta will tell how much volatility to expect on any given day.
Market-cap ranges are as follows: Mega-cap $200 billion or more, large-cap $10-200 billion, mid-cap $2-10 billion, small-cap $300 million - $2 billion, micro-cap $50-300 million, nano-cap below $50 million.
By doing a quick check on market cap size, you immediately know (for example) this company has a $1 billion market cap… it’s not a tiny company vs. seeing this company’s market cap is around $20 million. We could see some real volatility here.
You need to know, are you jumping long into, for example, a stock with a $50 million market cap, thin trading volume and a very high typical daily trading range? If so, you better be ready to maybe risk 10-20% of your overall capital put into that trade with the idea that you want to see 10-20%, or 50% or more on the upside. You also should plan on taking smaller position sizes in this kind of a trade vs. what you would do in a more normal, non-speculative trade.
Or are you jumping long into a large-cap play with very high trading volume (can get in and out of the trade very easily at current prices, give or take a few cents) with a moderate daily trading range? If you are in this kind of a trade, you don’t have to keep obsessively checking quotes on your smartphone when you are trying to relax on the beach.
Pretend you have $100,000 in your trading account. In the example of the stock with a $50 million market cap, we would be taking a position size of maybe $1,000-3,000. In the example of the large cap play, I would feel fine taking a position size that is much larger, maybe $10,000-20,000. Again, though, don’t apply this to every single situation. It’s a general guideline that we follow.
When looking at volume, look at the chart and time & sales. The chart shows if the stock trades in a spotty or choppy way, gapping up and down in a rather annoying way or not. When looking at the actual average trading volume we want to see at least 100,000 to 200,000 shares in trading volume. We mean that’s a minimum. Of course, the more volume there is, the most liquidity there is. Occasionally, we get into a trade that has something more like 50,000 to 100,000 shares average trading volume, but not often.
Looking at beta and average true range…
Let's compare a mega-cap stock that we all know vs. a micro-cap name (MSFT vs. SN).
- Microsoft (MSFT) has a market cap of $2.3 trillian, a beta of 0.8x (meaning that it is less volatile than the average stock) and an average true range of $4.50 (since the stock is currently $305/share, that implies that the stock has the potential to move as much as 1.5% on any given day)
- Let's now look at Takung Art (TKAT). This is a stock that has run from under $1 to a high of $74 as momentum traders got behind it as a play on NFTs (non-fungible tokens).
- TKAT has a market cap of $64 million, a beta of 3.1x and an average true range of $0.98 (since the stock is currently $5.50/share, that implies that the stock has the potential to move as much as 18% on any given day)
Remember that the stock market has a beta of about 1x. So, a stock like TKAT, that has a beta of 3.1, can be expected to move 310%, or 3.1x the general move in the market (S&P 500 move vs. TKAT move, for example).
Combined, these measures give you a quick decent picture of how much volatility you should expect in this trade in any given day, whether you go long or short.
#3: Use a scale-in approach
Don’t plan on getting long a stock all at once. Of course, occasionally we can do this and it’s no problem (i.e., maybe you want to buy U.S. Steel (X) at $31/share and risk a strict $0.50 with size. That’s okay).
But, in general, if you want to get long, plan on adding once or twice… or maybe even a little more, depending on if the trade is with a higher quality company or not. We don’t really want to try and perfectly time when to buy into a stock one time.
For example, if we want to get long Palantir Tech (PLTR) at $25.00/share and we plan on scaling in, we will take our initial position at $25.00/share, but we won’t plan on adding until the stock has fallen about 5% or more. So, as an example, if we were to get long with the idea of adding two more times to my position, we would get long at $25.00/share and then add at around $23.75/share and then again around $22.50, giving me an average price of around $23.75/share.
Other basic rules:
-
Make it a habit to not hold a TRADE into earnings results unless you are specifically attempting to play the earnings print.
If you are certain that you plan on holding a stock for at least several months, and it's a quality company, then we can sometimes do it if we feel that we know the company well enough. - Remember, when you think a stock can't go any lower on any given day during a sell-off, it can, and it will.
- Don't make any one stock too large of a percentage of your trading account. If you have a lot of confidence in, for example, a certain long position, then increase the size. Otherwise, constantly monitor your position weighting in your account.
In summary:
Before you jump into a trade, do a quick check on these items. Know if your trade is a non-speculative trade or a speculative trade. Know it’s market cap, trading volume, average true range, and beta ahead of time. And be in the habit of scaling into a trade.
the most part, don’t hold a trade into earnings. And remember, when you think a stock can’t fall any more than it already has in any given day, it can, and it will.
Lastly, make higher-quality (non-spec, higher volume, lower ATR, and beta) trades a larger percentage of your account and lower-quality (spec, lower volume, higher ATR, and beta) trades a much smaller overall part of your account.
By applying these rules, we will properly manage two of the most important things in trading, proper risk levels and correct position sizes.
Disclaimer: Remember, this is a good general guide. This doesn’t apply to 100% of all situations. However, they almost do.
Guide to Stock Investing: Which Stocks to Buy for the Long Term
Long-term investments are any investments that you plan to hold onto for at least ten years. The basic idea is that by holding a stock longer, the stock would have more time to recover after downturns, so you can beat market volatility.
Many investors and wannabe investors understand the benefit of long-term investing, but unfortunately, many also don't know how to start. Indeed, identifying which stocks are good long-term investments and which aren't is easier said than done.
In long-term investing, we are discouraged from selling early and switching to other stocks, so it's important to choose right the first time around.
In this article, we'll discuss how to identify good long-term buys.
Key Factors to Consider Before Buying a Stock Long-Term
1. Investment strategy
There are three basic investment strategies that investors can adopt when picking stocks for long-term investing:
- Value investing strategy: The focus of this strategic approach is to find and invest in stocks that are currently undervalued (currently priced lower than their intrinsic value.) This strategy would mainly involve the use of fundamental analysis to determine the intrinsic value of the stock.
- Growth investing strategy: This strategy emphasizes investing in growth stocks, which are stocks of smaller or younger companies (i.e., startups) that are expected to increase at a rapid above-average rate.
- Income investing strategy: Finally, income investing is a strategy in which investors look for typically established companies that regularly pay significant dividends. These dividends, along with price appreciation of the stocks, would result in increased return potential.
All three of these strategies can be applied in long-term stock investing, but as you can see, the choice of stocks in each strategy would differ greatly.
So, before anything else, assess your investing style and risk profile so you can choose the best possible strategy that fits you. Keep in mind that you don't need to adopt only one exclusive strategy. You can combine two or even all three of them.
2. Fundamental Analysis
Although technical analysis can play its part in long-term stock investing, fundamental analysis is more widely used, especially with a value investing strategy.
Fundamental analysis is performed by keeping track of numerous macroeconomic and microeconomic factors related to the stock's performance, including industry conditions, geopolitics, and others.
However, in relation to finding long-term stocks to invest in, we can focus on monitoring several key fundamental metrics of the stock in question:
- Earnings per Share (EPS): The company's net profit divided by the number of outstanding common shares. Useful for estimating the stock's intrinsic value and is also important if you are adopting the value investing strategy.
- Price-to-earnings (P/E) Ratio: Current stock price divided by the annual EPS. The lower the P/E ratio, the higher the stock's intrinsic value is. It is important, however, to compare a stock’s P/E ratio against the stocks of other companies in its industry to gauge its relative value.
- Debt-to-equity ratio: Helps determine how much the company is in debt. A high debt-to-equity ratio may be a sign that the stock is a high-risk investment.
- Price-to-earnings-growth (PEG) ratio: The company's P/E ratio divided by the expected growth rate of the annual earnings. For example, a company with a P/E ratio of 10 and 10% expected annualized earnings growth over the next five years would have a PEG ratio of 1.0. A low PEG ratio could expose a good value opportunity.
3. Market Capitalization
The size of the company you plan to invest in would determine the risk you'll assume when buying the respective stock.
The size of a company can be determined by looking at the company's market capitalization. Companies with larger market capitalizations are typically less risky to invest in: they tend to be established names and are less vulnerable to takeovers and price wars, and are less volatile in general. They also generally have more trading liquidity, making it easier to get in and out of the stock when desired.
However, smaller companies may have the potential to grow at a rapid rate, which may be a factor to consider if you decide to adopt the growth investing strategy.
4. Mutual Funds Holding
A good indicator of whether a company is safe to invest in long-term is to check how many mutual funds hold the stock. A stock that is held by many mutual funds is generally considered more low-risk to invest in.
5. Revenue Growth
For long-term investing, regardless of strategy, it's very important to check whether the company is growing. A good way to do so is to assess growth in its revenue and its earnings.
6. Dividend History
A very important metric to monitor for investors who'd like to adopt the income investing strategy. Companies with high dividend yields offer some nice income potential, but high dividend yields often correlate with lower stock prices, so it is important to understand why a stock has a high dividend yield before investing in it.
Preferred shares, on the other hand, typically don't have voting rights, but they have priority over common shares to receive dividends (hence the name "preferred.")
However, even if you adopt strategies other than income investing, monitoring how consistently a company can pay and raise its dividends is a good way to measure its financial stability.
Monitor at least five years of dividend history to give you a clear idea about dividend consistency.
7. Volatility
Although long-term investing naturally allows investors to avoid market volatility, in general, low-volatility stocks are preferred since they'll give investors more time to exit an investment (i.e., to take profits) when needed.
8. Identifying Value Traps
A value trap in the context of value investing strategy is when the stock looks cheaper than its intrinsic value but will go down in value in the future or simply not go anywhere for an extended length of time.
There are two key metrics to monitor to identify whether a stock that seems undervalued is a value trap or otherwise: current ratio and debt ratio.
- Debt ratio: The percentage of assets that have been financed with debt. Calculated by dividing the company's total liabilities by total assets.
- Current ratio: To get the current ratio, we divide the company's current assets with current liabilities, hence the name.
When a company has a current ratio of three, it means the company is liquid enough to pay three times its liabilities.
The higher the debt ratio, the more likely the company is a value trap, while the higher the current ratio, the more likely it is a financially viable company.
9. Earnings Projection
One strong metric to monitor to evaluate whether a stock is a good long-term investment is to watch for fluctuating earnings by evaluating past earnings and future earnings projections.
If the company's past earnings history shows a consistent rise over a period of many years, it could be a sign of a good long-term investment.
On the other hand, evaluate the company's future earnings projection and whether it's expected to remain strong.
How to Be Successful in Long-Term Stock Investing
On the surface, long-term stock investing may seem quite simple.
However, in practice, buy-and-hold isn't as simple as it sounds. Not only does it require a good selection of stocks (as we've discussed above), but it also requires a strong mentality and discipline to remain focused on long-term financial objectives.
In this section, we will share some actionable tips to help you be successful in long-term investing:
1. Don’t time the market
The term ‘market timing’ refers to the practice of buying and selling equities (in this case, stocks) in an attempt to profit during the market highs while avoiding the lows.
Simply put, even with all the ‘advanced’ analysis techniques, trading robots, and other methods, 100% accuracy in timing the market is impossible, and it is extremely risky.
Unfortunately, the trap of trying to time the market has tripped even the most experienced and knowledgeable investors. Many have sold their stocks during a down period, only to lose out on gains when the price suddenly rises again, and vice versa.
So, don’t fall into the same hole. The idea of long-term stock investing is that historically over the long term, the stock market has always recovered from down periods.
2. Don’t be afraid to sell a loser
An important principle in long-term stock investing that you should keep in mind is to cut your losses fast.
It’s important to be realistic when a company is poorly performing with no signs of bouncing back in the near future and sell them ASAP. Yes, acknowledging our failure in choosing this stock may feel embarrassing, but there’s actually no shame in cutting your losses early.
What’s important is to learn from your mistakes and keep improving your portfolio.
3. Stick to your chosen strategy
Pick a strategy (as we’ve discussed in the previous section) and stick with it.
Switching between different strategies while reacting to different situations actually makes you a market timer, which, as we’ve discussed above, is very risky and dangerous.
Yes, you can change your strategy if it's absolutely necessary, but make sure there’s a sound analysis behind it.
Another related practice is to never accept a hot tip as valid as-is, regardless of the source. Always do your own analysis on any stock before buying/selling any company or changing your strategy.
4. Diversify your investment
If you put all your investments in a single company, you could expose your money to too much risk or vice versa; you may miss out on potential returns you’d otherwise get from other stocks.
Consider spreading your investment on different stocks in different industries and even across different asset classes (U.S. Treasury bills, CDs, real estate, fixed-income investments, etc.).
While there’s no guarantee that diversifying your assets can reduce risks or increase returns, it’s typically a better practice than keeping everything in one basket.
5. Monitor your progress and adjust
Keep tabs on your portfolio’s progress.
Market swings may shift your investment’s performance away from your objective, and when this happens, you should make adjustments to your portfolio, whether by moving your money between investments, selling loser stocks, or adding new companies to your portfolio.
Whenever there’s any big change in your life situation (a new baby on the way, a marriage, a divorce, a raise, etc.), you may also want to adjust your investments, whether to put in more or less money each month.
However, anytime you make any changes to your portfolio, make sure they remain diversified enough to maintain a risk level according to your risk profile as an investor.
6. Keep taxes in mind, but don’t overthink it
While it’s important to be reasonably concerned about taxes, you shouldn’t overthink it. You should reasonably try to minimize tax liability, but it should be secondary to investing and achieving high returns.
So, avoid the mistake of becoming overly paranoid about taxes and putting tax concerns above all else.
Wrapping Up
The most surefire way to make money in stocks is to buy shares of high-quality companies at reasonable prices and then hold on to the shares until you make profits. This long-term strategy allows you to produce great investment results, even if you experience some volatility along the way.
How Do Stocks Work?
The idea that investment is the most surefire way to financial freedom is no secret to many and investing in stocks remains one of the most popular and safest options available.
However, if you're fairly new to investing, the idea of investing in stocks might seem overwhelming at first, and if you are currently in that place, know that you're definitely not alone.
Just as with starting anything new, you'd want to learn before jumping in, and you've come to the right place.
In this guide to stock investing, you'll learn how to understand stocks and the basics of stock investing that will get you ahead of the curve.
By the end of this guide, you'd have learned about:
- What are stocks?
- Why invest in stocks
- How does the stock market work?
- How to identify the right stocks to invest in
- Mitigating the risks in stock investing
And more. Let us begin this guide with the basics: what are stocks?
What are Stocks?
A stock is a type of financial security that enables us to own a fraction of a company/corporation. A stock represents the ownership or equity interest of a company, and the equity is established on a per-share basis.
Companies issue stock shares to raise financial capital for the company, while investors (and traders/speculators) purchase these stocks with the hope that they'll generate some form of future profits.
Owning a stock means that you (as a stakeholder or stockholder) own a portion of the company equal to the number of shares held as a proportion of the company's total outstanding shares.
For example, let's say company A issued 1,000 stock shares worth $100 each ($100,000 outstanding shares), and you purchase ten shares worth $1,000. In this example, your investment is worth $1,000, and you technically own 1% ($1,000/$100,000 x 100%) of the company.
The owners of stock shares are referred to as stockholders or shareholders and technically have a 1% ownership stake in the company.
Why Businesses Issue Stock Shares
Many businesses started out small, from the founder's garage or other small beginnings.
Many of these small businesses would fail during the first few years of operations, but some flourish into established companies that are able to generate profits.
Yet, sooner or later, these established businesses would also hit a plateau, but if they stop growing, they'll lose to their competitors. At this time, to grow further, the business will need to raise more capital.
Selling Shares as a Way to Raise Capital
Basically, all businesses have two main options to raise more money:
1. Borrowing money from lenders or debt financing
2. Selling its assets or equity financing
Selling shares is a form of equity financing.
Companies can get equity financing from venture capital firms or angel investors, which is a viable option taken by many startups. However, selling shares to the public through a process called initial public offering (IPO) would allow the business to gain access to a much larger capital pool.
Private vs. Publicly-Traded Company
Before an IPO, the company is considered a private firm whose ownership is held by the original founder (or a small group of owners.)
However, once the company undergoes an IPO, it changes its status into a publicly-traded company whose shares will be owned by a potentially massive number of the general public.
After the IPO, this company's shares are listed on a stock exchange (more on this later), and the price of these shares fluctuates according to trading volumes and other factors.
Different Types of Stocks
Before investing in stocks, it's crucial to understand that there are two different types of stocks traded: common stocks and preferred stocks. One type might suit your financial objectives better than the other, so it's important to understand the differences between the two.
The main difference between the two is voting rights. Common shares usually carry voting rights, enabling the owner to have a say in board meetings, elections, and other corporate meetings.
Preferred shares, on the other hand, typically don't have voting rights, but they have priority over common shares to receive dividends (hence the name "preferred.")
In the event of a liquidation, preferred shareholders are also prioritized to receive assets over common shareholders.
From an investment point of view, shareholders owning common stocks have a higher return potential than those with preferred stocks. However, common shareholders also face an increased risk of losing their money when the business has gone awry (i.e., in the event of bankruptcy).
Classification of common stocks
Some companies further divide their common stocks into different classes. This is mainly done to further differentiate shareholders' voting rights and dividend privileges across the different classes.
For example, a company may adopt the dual-class structure for its common stocks, dividing the stocks into class A and class B. The class A stocks can be designated two votes per share, while the class B stocks have one vote per share.
If necessary, the company can adopt multiple-class share structures, for example, with classes A, B, C, and D.
Classification of common stocks provides companies with better control over their strategic direction, agility, and ability to innovate.
Why Invest in Stocks?
Stock shares remain a popular investment instrument due to the fact that, at the moment, they have a relatively high ROI that exceeds most other prominent instruments such as real estate and bonds.
This is because, other than the standard price appreciation that you would get on other asset classes (i.e., real estate), stocks offer another way to achieve ROI in the form of dividends.
Dividends are payments made by the company to its shareholders (or stockholders.) Dividend payments typically represent a portion of the company's current year's net earnings. In some cases, companies may also pay special dividends to shareholders, for example, from asset sales.
In cases of whale investors with significant ownership stakes, they may also look at the voting rights provided by stock ownerships as a potential way to achieve ROI. However, this is rarely a focal point for most investors with relatively uninfluential ownership stakes.
In an ideal stock investing scenario, the investor would profit from both high dividend yield and high price appreciation. Yet, in practice, not all stocks pay dividends every year, and there are always cases when the stock decreases in price rather than increases.
This is why maintaining a diversified portfolio is important in stock investing. Smart investors should invest in a variety of companies in different industries, sectors, and geographic locations.
How Does a Stock Exchange Work?
A stock exchange is, simply put, a secure and legal place where stock trading is done in a systematic and organized way. A stock exchange is technically a type of secondary market where investors and traders can buy and sell stock shares they already own.
How to Make Money from Stock Investing
Now that we've understood how stock ownership and the stock exchange work, we can see that there is more than one way we can profit from stock investing.
Yet, despite all the different stock investing methods available, we can generally differentiate them into just three basic methodologies. You can either stick with a single method or use all three in your stock investment strategy, and they are:
- Selling at a profit: the classic stock investing strategy is based on price appreciation, and the goal is to buy stock shares when they are undervalued and then sell them when the price has gone up (the classic buy low, sell high).
- Collecting dividends: as we've discussed above, companies may pay cash dividends to their shareholders, and collecting dividends can be an effective way to make money from stock investing. Dividend payments are typically issued quarterly.
- Short selling: short selling is typically achieved by borrowing stock shares from a stockbroker (or other lenders), selling them on the stock market, and then buying the same stock later when the price has dropped. Essentially, in short-selling, we are betting that the stock will decrease in value, the opposite of the buy low, sell high strategy.
With only these three methodologies, theoretically, there are always ways to make a profit from a specific stock share, whether it's currently trending up or down in value. However, knowing which approach you should take at any given moment can be very difficult in practice.
Primary vs. Secondary markets
When a company issues stock shares for the first time on an IPO and sells these shares directly to investors, this specific transaction occurs on the primary market.
A key distinction of the primary market is that 100% of proceeds from the sale of stock shares go to the company that issued the stock shares, only accounting for the bank's processing fees.
If any of the investors who purchased the stock during the IPO later decide to sell their stock shares, then they must do so on a secondary market, including a stock exchange.
Any transactions on the secondary market happen between investors or traders, and typically the company that issued the stock isn't directly involved. The proceeds of each sale would go to the selling investor, not to the company that issued the stock or the underwriting bank.
Another key difference to consider is that the stock's initial market price on the primary market can be set beforehand, while prices in the secondary market (i.e., stock exchanges) would fluctuate depending on supply and demand forces.
Fluctuation of Stock Prices
Prices of stock shares traded in the stock exchange (secondary markets) would fluctuate, determined by the basic forces of supply and demand. This price volatility is one of the factors driving the popularity of stock shares as an investment instrument, inviting a lot of traders to speculate on stock investing.
When the demand for a stock dwindles, for example, or when the company fails to pay dividends, its price goes down. On the other hand, if the majority of traders and investors believe that the company is doing well and is rushing to buy the stock, then the stock's price will rise.
For every stock transaction, there must be at least one buyer and one seller (in such cases, the price will stay stagnant.) If there are more sellers of the stock than the buyers, the price will go down and vice versa; if there are more buyers than there are sellers, the price will trend up.
How Share Prices Are Set
Although the stock shares' price on the stock market is driven by the supply and demand principle, in practice, the price is set through an auction process, in which buyers and sellers of the stock shares offer to buy or sell while placing bids on the stock exchange.
A bid refers to the price at which an investor or trader is willing to buy, while an ask (or an offer) is the price at which a seller wishes to sell the stock.
On the stock exchange, a trade is made when the bid and ask amounts coincide.
In this process, obviously, there will be times when the bid and ask don't coincide, creating a condition we call bid-ask spread (or bid-offer spread).
The bid-ask spread represents the difference between the highest bid price of a stock and its lowest offer price.
Since a trade transaction would only occur when either the seller takes the bid price (lowering its offer) or when a buyer accepts the ask/offer price, naturally, the price would fluctuate.
When the number of sellers outnumbers buyers (and so they can't sell their stocks), some sellers may be tempted to accept the lower offers for the stock, and buyers will also lower their bids to force the price down.
On the other hand, when buyers outnumber sellers, the stock shares would become scarcer, and buyers may be willing to raise their prices to acquire the stock faster. In such situations, however, sellers would typically also raise their offers, further increasing the price.
Stock Investing Best Practices
1. Know your risk profile and financial objective
- Risk tolerance: refers to how much money you are willing to risk in stock investing. The higher the risk tolerance, theoretically, the higher the potential profitability.
- Time horizon: how long are you willing to wait for the stock investment to generate profit (or not).
Assess your risk tolerance and time horizon, then identify your investment goals. What do you want to accomplish financially at the moment? How can stock investment help you in achieving these goals?
Understanding your financial goals and your risk profile can significantly help in choosing the right stocks to invest in and in identifying the right investment strategy for you.
2. Stay invested in the long term
The stock market's average ROI is 10% annually, not accounting for inflation. This is a higher average than bonds, real estate, and other major investment instruments.
However, the stock performance will vary day by day, and the volatility will be higher the shorter your time horizon is.
The recommended practice is to invest for the long term rather than the short term, with a diversified stock portfolio, which can potentially net you an average of between 6% of 7% annual increase after accounting for inflation.
3. Maintain a diversified portfolio
Investing in any stock, even the best one, always carries risk and volatility. A stock you've invested in may do well this year only to perform badly the next, and vice versa; some might do very badly this year only to increase 500% the next.
Therefore it's important to keep a diversified portfolio of different companies in a wide variety of industries, sectors, and geographical regions. Mix some high-risk, high-reward stocks with conservative ones.
Having a diversified portfolio may mean a lower potential return, but you'll also be able to minimize your long-term risks.
4. Invest regularly
Not only should you stay invested for a longer time frame, but you should continue to contribute to your investment regularly to maximize compound interest gain.
Fortunately, there are now many investment apps and platforms that can help investors in scheduling their regular contributions. You can, for example, automate the account to take a specific amount each week or each month.
5. Start early
The best time to invest in stocks was 20 years ago, and the best possible time you still have access to is right now.
The earlier you start investing, the more you can maximize the compounding return of the stock investment and the more opportunities you'll have to buy the stock at a lower cost in the long term.
Start as early as possible and continue to grow your investment with regular contributions.
Wrapping Up
Stocks should be a staple in every investment portfolio with their potentially high return that outperforms other major asset classes like real estate.
However, although stocks have a history of high potential ROI, they can expose their investors to a lot of short-term risks. Therefore stocks should be considered as long-term investments rather than short-term speculations, and it's recommended to keep a diversified stock portfolio across different industries and sectors.
Nowadays, maintaining a diversified stock portfolio is not only easier but much more affordable, thanks to a wide variety of ETFs (Exchange Traded Fund) and low-cost index funds.
How Does Inflation Affect Stocks?
After over a decade of moderate inflation, we’ve recently experienced a price spike. Inflation has been brought on by various circumstances, including supply chain disruptions, lockdowns resulting from the pandemic, and a significant monetary impetus.
But exactly how does inflation affect stocks? Read on to discover the essential information about inflation and which investing approaches perform the best over time.
What Is Inflation?
Inflation happens when costs for products and services rise steadily over time. When measuring inflation, however, food and energy are excluded because they sometimes change more drastically than the prices of other products and services.
The Federal Reserve increases the currency in circulation, which consists of liquid assets and cash in circulation. If there’s a significant increase in the currency in circulation, it can be an expedient for inflation pressures. The currency in circulation rose 3-5% per month from 2015 through March 2020. However, the Federal Reserve employed unconventional measures to counteract the economic turmoil caused by COVID-19; thus money supply increased by 20% every month starting in March 2020.
Along with increasing the currency in circulation, additional variables that contribute to inflation include a larger economy, more stringent regulations, supply chain interruptions, and fluctuations in the exchange rate. In addition, pent-up demand was eventually released following the COVID-19 pandemic lockdown. As a result, inflation rose to 7.9% in early 2022, a 40-year high.
Here are the two major types of inflation:
Demand-Pull Inflation
Our purchasing power grows when we have extra cash on hand. Demand for goods and services rises as a result. When this occurs, we observe an increase in the cost of goods and services, which, in turn, increases the profitability of businesses.
This is also referred to as demand-pull inflation. For example, as COVID-19 spread at first, the demand for disinfection products increased while the supply stayed the same. As a result, people were willing to pay more in the face of an insufficient supply to meet the demand, which caused the price of disinfection goods to rise.
Cost-Push Inflation
When there are delays in the delivery of goods or services owing to shortages, inflation also rises. The rise in prices for oil brought on by the current situation in Ukraine is one example of inflation brought on by a decrease in supply. A spike in the price of many other goods, including agricultural commodities, has also been caused by supply restrictions and disruption.
Even though there isn't a sudden or considerable increase in demand with this type of inflation, an increase in prices happens due to a relative scarcity in the supply. As a result, businesses or consumers are responsible for bearing the burden of increased manufacturing costs. This is also called cost-push inflation.
Referring to our earlier example, as Russia exports 11% of the world's crude oil, its production was halted or reduced, and supply didn’t keep up with demand when the ongoing conflict threatened a range of commodities. Due to this disruption in supply, crude oil prices rose. Despite some government attempts to regulate the price of crude oil, this price increase was further passed through to consumers.
Companies' profitability or earnings could drastically decline if they pay this additional cost, influencing their profitability. Poor corporate profits are likely to affect its stock price expectation since a company's stock price and long-term returns increase in tandem with its earnings growth. On the other hand, if higher prices are passed through to customers, it will drastically cut their disposable income and, as a result, the amount of money that is available for investment.

How Share Prices Are Affected by Inflation
Four factors, including business profitability, consumer spending, investors’ expectations, and the overall economy, impact stock prices.
Organizational Performance
Similar to how it raises the cost of groceries, inflation raises the price of the inputs used in production, such as raw materials, overhead, and labor. Due to rising input costs, companies have decreased profit margins, thus having a negative impact on stock values.
Consumer Spending
Consumers frequently don't have enough capital to buy consumer discretionary products since inflation lowers their purchasing power. Consequently, declining products and services demand results in decreased corporate profit and reduced net profits.
The Economy as a Whole
When inflation reaches this severe and persistent stage, the Federal Reserve intercedes by increasing interest rates, which raises the cost of borrowing. More expensive borrowing makes companies less eager to take on debt and deal with ever-expensive debt payments.
Investors’ Expectations
The impact of inflation on stocks is also influenced by its psychological component. Stock prices are influenced mainly by investor expectations. If the present value of future cash flows is lower in the minds of investors, they will operate in a way that actually lowers it, thus causing the stocks to drop.
Are Stocks Beneficial During Inflation?
Because inflation lowers purchasing power and devalues money, stock investments could act as a hedge against inflation in the long run. However, not all equities do equally well in this regard.
Look for companies that produce goods that people will continue to buy even if they become more expensive to locate inflation stocks, i.e., stocks that are more likely to increase during inflationary times.
Consumer staples, like food, beverages, and home goods, healthcare firms, like health insurers and producers of healthcare items, and utilities, like electricity, oil, and gas, can all be considered among these so-called "defensive stocks."
In general, value companies outperform growth stocks during an inflationary period. Therefore, you should search for equities with a low price-to-earnings ratio compared to their competitors. These equities would be undervalued, making them more likely to outperform their rivals in terms of returns.

How Does Inflation Affect Stocks: The Bottom Line
Due to decreased risk, higher share prices, and dividend income, value investing is usually a better business investment strategy than growth investing during inflation periods. Growth stocks may outperform value stocks in low-inflation and low-interest rate environments, whereas value companies often perform better in inflationary environments. Arguably the best strategy is to combine value investing with choosing inflation-resistant securities.
How IPOs Work
We frequently get questions about IPOs. The ones that skyrocket on their first day of trading make investors wonder why all of them don't rise that much. Meanwhile some investors put in orders for an IPO stock, and end up overpaying, or failing to "catch the ride." We also get a lot of questions wondering how a stock can IPO at $15 but cost $60 on its first trade. Here's an explanation of how IPOs happen, and some suggestions for those wanting to get in on IPO day when you aren't part of the IPO.
The Company Decides to Go Public
The first step, of course, is that a company decides to raise capital by selling shares in a public offering.
To do this, it generally must have passed a certain level of "certification." In the old days, this meant that a company had proven its business model, shown good growth, had a reasonable business purpose for the capital, and generally had at least $10 million in revenues. And, oh yes, was profitable.
The bar was lowered considerably in the late 1990s as capital investors were willing to buy shares in unproven and/or unprofitable models, because the future seemed so fantastic. There is still a "bar" that must be passed, which is one of credibility. However, credibility can be gained by a compelling business idea, known venture capitalists, and known management.
The Company Hires an Investment Banker
To offer public shares the company hires an investment banker, or several bankers, as underwriters.
Investment bankers offer a simple service. They guarantee to the company that they will purchase all the shares the company offers on the day of the offering for the IPO price, minus the firm's commission.
Generally, the commission is between 5 and 7% of the amount raised. The investment banker is paid on a percentage basis, because it risks its own capital to buy all the shares.
Filing the S-1
The next step is that the company files an S-1 registration with the SEC, which is called the prospectus.
This form is a must-read if you decide you want to own the IPO stock for the long term. It is less important if all you want to do is flip the stock on the IPO day. But it is always wise to know as much as you can about the company.
Do not confuse the shares issued for sale with the total shares outstanding. Frequently, in reports of a new IPO the shares to be sold are listed as "Total shares." We have had some questions of confusion over this issue in the past, so make sure you know both the total shares offered and the total shares outstanding. Typically, in an IPO about 10-15% of the company is offered for sale.
The Investment Banker Sells the Deal
Investment bankers guarantee to the company that they will purchase all the shares.
But they intend to sell them, or at least the bulk of them, immediately to their institutional clients. Those clients must be "sold" first.
To do this, they take the CEO, and usually the CFO, of the company on a "road show" to institutions across the country. The road show gives institutions a quick presentation on the company's plans and the opportunity to ask questions of the CEO.
If convinced, the institutions "subscribe" to the offering, which is a non-binding commitment to purchase shares on the day of the IPO. Since the price is not determined until the last minute, institutions put in a subscription request for a certain number of shares, but the exact cost is unknown. They are not obligated to take any or all the shares if they so choose.
Investment bankers gauge the demand, and set a price as high as they can, balanced by trying to ensure that everyone will buy it.
Institutions are no different than anyone else. Some will argue the price. Others will just place an order.
Some will buy the IPO shares for long-term holding. Others will flip them as soon as possible. The investment bankers, who will be market makers in the stock, prefer to have friendly hands holding the stock for as long as possible. Instant flipping is not always looked upon favorably, but anytime you make money for a client, you have a happy client.
The Deal Closes
Prior to the IPO, investment bankers do their best to confirm all their client orders. If demand is high, the price may rise, at which time all the clients are called again, and subscriptions readjusted.
On the day of the IPO, when the investment banker is certain of selling all the shares, the deal closes. The shares, all of them, are purchased from the company by the investment bankers. The price paid is the IPO price minus the commission.
The bankers then sell all the subscribed shares to the institutions at the same time for the IPO price. If any client withdraws their bid, the bankers own the shares and either hold them, or sell them to someone else. On hot IPOs this doesn't happen much, but it does happen.
Note that the transaction between the client subscribers and the investment bankers always happens in accounts at the investment bank. A credit for the shares is placed into the client's account, and a debit for the cash is made, all at the same time. None of the clients get a "head start" on any of the others.
Shares Start Trading
The shares are "released" for trading when the investment bankers have made this credit in the client accounts.
At that point, any client who wants to can start selling.
Of course, the only market makers for the stock in the beginning are the underwriters.
So, if someone outside the institutional-investment bank relationship wants to buy shares, the only person they can buy them from are either clients of the underwriters, or the underwriter itself, as the market maker.
What Determines the First Trade Price?
Just like anything else in the stock market, the price is determined by bids.
Those bids are placed, just like any other bid, through a broker, who routes the bid to the market maker.
The stock market is an auction. When the guy next to you is willing to pay $50 and you aren't, you don't get the stock. And if the guy next to you says, "I'll pay more than whatever that guy is paying" (translate = market order), you don't get the stock.
The problem with IPOs is that there isn't any previous price for the stock. The IPO price is irrelevant. It represents demand among the institutional clients.
The first trade represents demand in the public market. Since the underwriter is also the market maker, (for Nasdaq stocks) they know exactly how many shares its institutional clients want to sell. They may even counsel clients to control the available supply.
But demand is completely generated from the outside. If there weren't market orders placed for IPO stock, there would never be IPOs that double or triple on the first trade.
No Trades in the Gap
So, the first trade goes out to the market orders. The price they pay is a "reasonable" amount higher than the limit orders in the queue. What the price winds up being is anyone's guess.
But it is important to understand - there were no trades in the gap.
When Briefing.com reports that an IPO has opened at $60, when the IPO price was $15, there weren't any trades at $30 or $40. The price just jumped, just like it does for non-IPO stocks overnight on news.
You haven't missed out on a $45 opportunity when you see that an IPO has risen from $15 to $60 on its first trade. The opportunity was never there.
How to Buy Stocks Online
For many people, the idea of investing and trading in the stock market is intimidating and overwhelming, preventing them from taking the very first step. Fortunately, getting started in the market and learning how to buy stocks online is not as difficult as it may seem, thanks to the variety of online brokers and trading tools that are available.
In this article, we will lay out a simple step-by-step process of buying stocks online that will kick-start your journey into the financial markets. However, before taking that leap, we strongly advocate that you get a feel for investing by paper trading. This is the practice of tracking trades without using real money. A simple way to accomplish this is to set up a hypothetical portfolio on Yahoo! Finance and to update it as trades are made.
After a few weeks, an understanding of your trading style and risk tolerance will emerge, putting you in a better position to dip your toes into the stock market and buying stocks online.
Finding and Selecting an Online Broker
Deciding which online broker is the best fit for your investing needs, style, and experience is the first task. Over the years, consolidation has dwindled the number of online brokers in the industry, yet there are still plenty of options for buying stocks online from which to choose.
The list includes Charles Schwab, E*Trade (now owned by Morgan Stanley), TD Ameritrade (now owned by Charles Schwab), Fidelity, Interactive Brokers, and Robinhood to name several. Briefing.com has a business relationship with each of these brokers, except Robinhood.
These firms may have different trading fees, charting tools, mobile app capabilities, research platforms, and educational resources, among other items. Determining which firm is best will ultimately boil down to an individual’s specific needs, budget, and comfort with the brokerage’s platform.
The scope of this article is not to “get into the weeds†and to evaluate every feature for every online broker, but we believe we can steer readers in the right direction.
Robinhood is a relatively new online brokerage service offering commission-free trading of stocks online and no fees when buying cryptocurrencies. It has become a very popular service for younger investors who are looking to buy stocks online.
Interactive Brokers tends to cater more to advanced traders who may be interested in trading options, futures, commodities, or currency products.
For our purposes, we will focus on capabilities revolving around online stock trading.
Charles Schwab, Fidelity, E*Trade, and TD Ameritrade are excellent sources for trading stocks online, offering a host of services that cater to the needs of all users, ranging from beginners to investment professionals.
Qualities one may want to prioritize in searching for an online broker include ease-of-use, stock screening and analysis tools, educational resources, and fees/required balances.
Applying and Funding Your Online Brokerage Account
Thanks to those $0 account minimums, it is possible to give each platform a test run before making a final decision. To do so, a fairly painless application process will ensue when opening an account. You can expect a few financial-related questions (net worth, annual income, etc.), in addition to inquiries about your trading style, the number of trades you expect to make per week or month, and what assets you plan to trade.
Once the application process is completed and approved, the next step is to fund your account to start trading stocks online. Mailing in a check with your account number written on it is an option, but we strongly suggest setting up electronic deposit and withdrawal capabilities. This route is much quicker, giving you access to your funds typically within a day or two, while eliminating the risk of losing a check in the mail.
To set this up, information such as bank account and routing numbers (can be found on a check), in addition to the username and password for your banking website, will likely be needed. If any troubles arise, a quick phone call to the online broker's customer service desk should be able to guide you through the process.
Trading Time
Now that an online broker has been chosen and the account is funded, it is time to take the plunge and make that first trade. Leaning on an understanding of your investing style (growth, value, income, etc.), and taking advantage of the stock analysis tools available at your brokerage, the perfect stock is lined up to be purchased.
Accordingly, a new set of decisions will arise. Specifically, how many shares are you looking to buy, what is the maximum price you are willing to pay, what type of order are you using to buy stocks online, and how much are you risking?
The first question relates to your personal risk tolerance, but we believe it is sensible to limit the risk per trade by starting out with smaller orders.
The maximum price you are willing to pay and the type of order you use go hand-in-hand. For a highly liquid stock — i.e., one that trades with a lot of volume — a simple market order is probably sufficient. This means that the market maker will buy or sell the stock at the best available price and that the order will usually be executed immediately. For smaller stocks that are more thinly traded, a limit order may be preferable because it allows you to specify the highest price you are willing to pay for a stock. In other words, you are communicating to the market maker not to execute the trade unless the stock can be bought below a certain price. The downside of this approach is that your trade may not be executed, even if the stock is just $0.01 above your limit price.
Finally, determining how much you are willing to risk is always recommended. As an example, if a $20 stock is purchased online, a trader may risk $4 to the downside, meaning that a sell will be triggered at $16. Through use of a stop-loss order, this transaction would be executed automatically, even if the trader is not logged into the brokerage account.
Conclusion
While this article is far from all-encompassing in terms of starting out in trading and investing, we hope that it sheds light on how easy it is to get up and running and buy your first stock online. One of the best aspects of online trading is that there are no minimum balances required at most brokerages, allowing traders to ease into the markets. After some initial legwork, we believe you will find that the effort was worthwhile.
How to Find Stocks For Swing Trading
If an individual has an understanding of the stock market, it’s highly likely that they might be in for a bright financial future. There are a variety of ways to approach the markets (e.g., investing in index funds, scalping stocks, trading options, identifying the next, big growth companies) but today we are going to focus on Swing Trading stocks and ETFs.
What Is Swing Trading
Swing trading is a strategy traders use to break through intraday noise to capitalize on price inefficiencies in markets.

The holding period can last from a couple of days up to a couple of weeks. This approach differs from day trading, which is a strategy that usually avoids carrying positions overnight. Day traders typically allocate more capital to their ideas (which often involves the use of leverage) and are often focused on making pennies and dimes rather than dollars. Technical analysis and pattern recognition are the primary skills used when Swing trading. Identifying stocks that are providing compelling technical setups is essential. Here’s how to start.
How To Find Stocks For Swing Trading
There are many tactics you can utilize when it comes to Swing trading, but the tried and true Technical Analysis strategies such as relative strength, moving average tests, and trendline breakouts are some of the strategies used by hedge funds and successful retail investors.
Briefing.com offers a variety of proprietary trading screens that focus on identifying the most attractive swing trading opportunities. This comes in handy when trying to narrow down trading ideas, to say a dozen, in a market that contains many thousands of stocks.
Relative Strength
Relative Strength is a form of Technical Analysis that assumes a stock’s positive relative performance, to the markets or a benchmark, will continue into the future. It is based on a view that a stock’s outperformance is for a reason, and that this buy interest and price support will continue to drive the stock higher over time and be supportive of price on short-term pullbacks. For example, maybe a new Software company is experiencing widespread adoption at major companies. Without contacts in the Software industry, you may only be made aware of this information after the stock gaps 25% higher in reaction to earnings. That this stock steadily made new 52-week highs before the big blowout earnings report, even as the rest of the market was pulling back, is an example of Relative Strength.
Liquid Momentum is Briefing.com's proprietary Focus List for up to 50 of the most liquid, high Relative Strength stocks in the market that are ideal for Day and Swing trading high-quality names. It is generated from a proprietary algorithm that places heavy emphasis on superior Relative Strength versus the "all stocks universe," high Average True Range (ATR) values, and high Average Daily Volume, among a few other data points. An updated list is published by each Monday, along with some charts and commentary throughout the week highlighting the most compelling set-ups and patterns.
Volume
Changes to volume and volume levels are some of the most important trading signals for technical swing traders. Swing traders can gather a lot of valuable data from volume as it enables them to thoroughly analyze a market trend. To minimize the risk of bad trade, swing traders take volume into account, as a trend with higher volume is likely going to be stronger than the one with weaker volume.
If the Volume strategy is incorporated alongside the Relative Strength strategy, swing traders can capitalize when a breakout occurs, and volume levels confirm the underlying strength.
Liquidity
The levels of liquidity are indicators of market demand for that particular stock. Liquidity is calculated by how many shares per day are sold and stocks with high daily trading volume are considered liquid.
Great liquidity would be a $30 stock with a bid/ask spread of one penny. Poor liquidity would be a $30 stock with a bid/ask spread of $1.50. This stock would require a move of $1.50 before you could make money on your position.
Volatility
Another important swing trading strategy is closely analyzing the volatility of the stock. Volatile stocks have a higher chance of breaking away from the trading range, which in turn could mean more profit for you.
Furthermore, analyzing volatility helps you decide whether the stock is worth investing in or not by carefully following the stock price movement. As a general rule of thumb, high volatility is not always bad, the best-performing stocks sometimes tend to be volatile.
To help them determine the volatility and choose whether they should invest in a stock, trading experts can use volatility indicators. At Briefing.com, our proprietary indicators generate ideas such as “Strong Volume Move Above Recent Resistance†and “Stocks Under $25 with Strong Up Momentum by Volume.â€
Bottom Line
Swing trading is a method of trading that can add up and make for a significant annual income. However, there’s a lot of work involved. Swing traders must know the basics of how to find stocks for swing trading and how to capitalize on trading opportunities.
Analyzing chart patterns, along with the strategies we outlined above will help your swing trading efforts play out in your favor. Knowing how to scan stocks for swing trading will take your position trading game to the next level.
How to Find Stocks to Invest In: 4 Key Steps
Consumer prices in the United States have risen by a staggering 6.8 percent between November 2020 and November 2021. And with inflation rates continuing on an upward trend, that number is increasing.
One way to protect yourself against your money losing value is to find effective investments in the stock market that will continue rising in value over the long term.
But finding the right approach isn't easy. There are an abundance of information and tactics you can find online, each promising you the best possible earnings growth.
Whether it's buying an undervalued stock, following the picks of experienced investors, or trying to gain a competitive advantage through tracking stock screeners, there are a variety of ways you could try to gain the upper hand.
The good news is that even if everything seems very confusing right now, getting started with finding and buying quality stocks isn't that difficult.
In fact, you can start buying shares of companies as soon as today, minimizing the risk and putting yourself in a good position over the long term.
With that in mind, let's look at some of the key steps you should go through when investing in individual stocks. But first, let's answer why you should invest in individual public companies in the first place.
Why Invest in Individual Stocks?
When deciding how to invest your money, you have many options to consider. And sometimes, the number of options can become overwhelming.
There are stocks, bonds, mutual funds, ETFs, annuities, options, and various other financial instruments you can use for capital preservation and the best profit margins.
However, there are many reasons why stocks are one of the best ways to maximize your investments and diversify your portfolio.
For one thing, when you buy an individual stock, you have much more control over where your money goes. Even though you have to compromise a bit in terms of diversification, you can invest in companies you know and trust.
In fact, investing in a particular stock allows you to align your investments with the companies that you like and want to support. If you believe in a certain type of technology or service, you can invest in its future directly and reap the benefits of the company's success.
Another compelling reason to choose individual stocks is that many prominent companies offer dividends to investors. This way, you can earn money not just through the rising stock price but also by receiving a share of the profits based on the number of shares you own.
Public companies regularly pay dividends to the shareholders after successful periods, which means you can earn money from ownership without having to sell the stock itself. And that can amount to a significant amount over the long term.
Finally, when you invest in stocks instead of mutual funds or ETFs, you also don't have to worry about paying management fees that can eat into your returns. Even though the degree of risk might be reduced by using ETFs, the long-term management fees can amount to a significant cost that you could otherwise avoid.
Of course, when buying individual stocks, you need to consider how you will diversify your portfolio to not expose yourself to too much risk if one of the companies you invest in were to underperform.
In the end, investing in stocks is an integral part of creating a diverse portfolio. Even though funds do have their place and can provide an additional layer of security, investing in growth stocks on your own can give you more control over where you put your money and also provide you with dividends in many cases.
Finding stocks to invest in: Key Steps
Now that we've gone through some of the main benefits of investing in stocks, let's go over some of the critical steps you should take when creating your direct stock purchase plan.
Determine Your Goals
Just as with any plan, the end goal will typically determine the types of decisions you end up making. And the same applies to stock investing as well.
When looking at share prices, whether for educational purposes or investing, you need to understand what each stock purchase will help you achieve.
For instance, the types of stocks you choose to invest in can be determined by factors such as your age. If you are younger and still have many years of generating income, you can tolerate more risk in your investment to maximize potential returns.
However, if you are an older investor, you will probably be more interested in protecting your capital and minimizing the risks in your portfolio. Still, if you already have accumulated more money to invest, you may reap good returns from stocks even if you stick with safer options.
At the same time, you should consider how important immediate income is in your stock investing strategy. If you want to receive regular dividend yields, you will need to look for companies known for paying out regularly and generously.
However, most companies that pay out dividends are usually well established, which means there's not as much room for value growth. If you want to maximize growth and an increase in share prices, you might be more interested in stocks of younger companies that show a lot of promise for growth. But these types of companies also come with more risk, which you need to consider when diversifying your risk.
Whatever investing strategy you end up going with, the key part is understanding and internalizing the value and the risks that come with it. That way, you can stay consistent in what you are doing and avoid panic if some of the risks that come with your plan should materialize.
Invest in What You Know

As mentioned before, one of the key advantages of finding and investing in individual stocks is the ability to handpick the companies you want to own a part of.
Instead of investing in a fund with hundreds of companies, you can be very deliberate about the types of businesses you choose, which gives you a lot of control over the entire process and investing outcomes.
However, for this strategy to work, you can't rely on what others are doing or on superficial guesses about what might work in your situation. When you invest in a company, you need to understand not just the current situation of the stock but also the business itself.
Whether you like it or not, investing in stocks will require you to do at least some research so that you know what you are getting into. The good news is that if you do the proper research, you can invest with much more confidence and get better at recognizing opportunities.
An excellent way to find companies to invest in is to look at the environment you encounter every day. Whether it's the technology you use, the equipment used to run the world around you, or even things you and your circle seems to enjoy, you should always be on the lookout for new industries or sectors to research so that you are continually expanding your horizons and portfolio diversification opportunities.
Consider the Price
Price is crucial when determining whether it's a good time to invest in a specific stock. And therefore, you must be capable of correctly evaluating whether it's a good time to invest in stock through technical analysis of its current price, the company's financial situation, and a few other vital factors.
For starters, a good measure to identify how the value of a stock compares to its current price is to look at the price-to-earnings ratio. Basically, it's a way to figure out whether a company's price is lower than usual in relation to its profits and growth.
This method works best when used to calculate the stock value of well-established companies that have a lot of historical data to work with.
If your main focus is getting as many dividends as possible, you can look at the yields of specific stocks as one of the key deciding factors. However, even if the dividend yield is above average, you need to make sure that the company will be able to keep paying the shareholders regularly by remaining profitable and sustaining growth.
In the end, your goal should be to find lucrative stock opportunities that are currently priced lower than they are worth, based on your evaluation. So, the biggest challenge will always be collecting as much information as possible so that you can trust your evaluations.
Protect Yourself
Finally, as an investor, you should select stocks based not only on the lowest price but also on the amount of risk you can tolerate.
Even if a stock is valued lower than usual, you need to evaluate whether the price will bounce back or if the fall is related to more significant issues that may spell even more trouble in the future.
At the same time, you need to consider stocks that provide you with a safety margin you can use to cushion investments that don't work out.
For more established companies with a proven track record, even 10% below the price you believe it should be valued at might be enough to offset some of the risks. But for newer companies that are still growing, you should try to have more room for error and buy stocks that are valued significantly lower than what you believe they should be worth or could be worth in the near future.
Bottom Line
Investing in individual stocks can be riskier than simply sticking with mutual funds or ETFs. But at the same time, it gives you more control over who you invest in, allows you to reap direct profits from dividend yields, and provides another financial tool for diversifying your portfolio.
With the steps listed above, you should have a solid starting point for finding stocks to invest in and identifying the right opportunities for your long-term goals and current situation.
How to Find Undervalued Stocks: An Ultimate Guide
It’s human nature to love discounts: we love to buy things when they are underpriced and make the most value of them. This is true in all kinds of things, expensive or otherwise, and the same behavior is also prevalent in investing.
In fact, the most basic principle of investing, including stock investing, is to buy at a low price and sell at the highest value possible to make the most profits.Â
This is why many investors spend their time looking out for undervalued stocks, both to reduce the risks of the investment and to maximize their potential reward.
In this guide, we will discuss all you need to know about how to determine if a stock is undervalued, and by the end of this guide, you will have learned about:
- What is an undervalued stock?
- Different stock selection criteria one can use to determine whether a stock is currently undervalued
- Fundamental stock analysis and technical analysis techniques to find undervalued stocks
- Using the help of stock picking services
- Do’s and don’ts of purchasing stocks to maximize value
What Is an Undervalued Stock?
An undervalued stock is a stock that—according to you, based on assumption, analysis, or other methods— is currently priced on the stock market lower than its true (intrinsic) value.Â
For instance, let’s say Amazon’s stock is currently priced at $100 per share on the stock market, but you think that it should be worth $150. In this case, Amazon’s stock is assumed to be currently undervalued.Â
The assumption is the keyword there, since different investors and different “experts†may use different criteria to determine whether a stock is undervalued, fairly valued, or overvalued. These criteria can be based on many different things: the company’s financial performance, current stock market trends, and other data.
This guide will be focused on discussing these different criteria and an analytical framework on how to identify these undervalued stocks.
Value Investing and Undervalued Stocks
Why do investors look for undervalued stocks in the first place? The answer is an investing methodology called value investing.Â
Value investing was introduced by none other than Benjamin Graham, a famous 20th-century investor. Value investing is also practiced by Warren Buffet, considered by many to be the world’s greatest value investor. This method focuses on purchasing undervalued stocks and then selling those stocks when they are fairly priced (or, even better, when they are above the computed intrinsic value at the time of purchase).
In most cases, however, it can take months and even years before an undervalued stock reaches its fair price range (and there are also cases that the price never actually goes up). So, value investing is more suited for patient investors who’d like to invest long term.
The key to the value investing strategy is properly identifying undervalued stocks, which is typically performed via top-down analysis. To really understand top-down analysis, we must first understand that there are two basic approaches used for analyzing stocks: bottom-up and top-down.
Two Basic Methodologies for Analyzing Stocks
Before we dive further into finding undervalued stocks, we must understand that there are two basic methodologies for analyzing stocks.Â
All other stock selection techniques and methods are derived from these two approaches:
- Top-Down Analysis Methodology
In this investing analysis approach, the investor or expert starts the analysis by looking at the overall economic situation (the top) like the country’s monetary policy, inflation, economic growth, and so on. Then, the investor will analyze the sector/industry the target company is in before finally analyzing the individual company.Â
With a top-down approach, the investor or expert will first look for macroeconomic and/or sectoral factors and try to identify opportunities from those factors. For example, the global COVID-19 pandemic was a major macroeconomic factor to consider throughout 2020 and 2021, and there were numerous investment opportunities that arose from it (e.g., Zoom at the early days of the pandemic).
In many cases, top-down investors are more focused on capitalizing on larger trends than individual stocks, so the strategies derived from this approach are typically more focused on trying to get short-term gains rather than using a more value-based analytical framework to identify undervalued companies.
- Bottom-Up Analysis Methodology
With a bottom-up approach, the investor or expert starts the analysis process by first looking at target companies (individual stocks), analyzing the attributes of each stock and especially the microeconomic factors surrounding the stock.
The bottom-up analysis methodology is the one focused on finding undervalued companies based on various stock selection criteria (which will be discussed further below in this guide).Â
The bottom-up analysis methodology is more focused on long-term investing (buy-and-hold). Investors/experts employing a bottom-up methodology tend to invest more time in researching individual stocks before making an investment decision.
Investments made with a bottom-up approach may take a longer time to be profitable, but the risks associated with the investment may be more manageable. This type of investment is less likely to be affected by macroeconomic factors, hence the lower risks.Â
Popular Stock Selection Criteria
In this section, we will discuss two popular stock selection criteria created by two famous investors: Benjamin Graham—considered by many to be the pioneer of value-based investing with his book The Intelligent Investor— and another one by the famous investor Warren Buffet of Berkshire Hathaway.
Benjamin Graham’s Stock Selection Criteria
Benjamin Graham’s stock selection criteria are among the oldest methodologies available to identify whether a stock is currently undervalued
Here are some of the most important criteria used in Benjamin Graham’s methodology:
- Stock price:
- Should be less than two-thirds of Net Current Assets
- Should be less than two-thirds of Book Value (Book Value refers to the net difference between total assets and total liabilities)
- Price-To-Earnings (P/E) Ratio
- Should be lower than 40% of average P/E ratio for the last 5 years
- Should be lower than the inverse yield of AAA corporate bonds
- Dividend Yield: more than two-thirds of AAA Corporate Bond yield
- Current Assets: more than double the company’s current liabilities
- Debt/Equity Ratio: less than 1 (equity should always be higher than debt)
- Outstanding Debt: less than 2 times of Current Assets
- Earnings: only 2 years of negative earnings are allowed
- Earnings per Share: should grow more than 7% over the past 10 years
While Benjamin Graham’s stock selection methodology is old and has been widely used since the 1940s and even the late 1930s, that doesn’t mean it’s obsolete. One can still use these criteria as a solid foundation in finding undervalued stocks, although one can add more modern criteria to improve accuracy.
Warren Buffet’s methodology is newer with more modern principles involving analysis of qualitative factors which we will discuss below.
Warren Buffet’s Stock Selection Criteria
Warren Buffet’s stock selection methodology is based on the qualitative evaluation of four key areas: Business, Management, Financial, and Market. Below is the breakdown of Warren Buffet’s stock selection criteria:Â
- Business:
- The business model must be simple and understandable
- Has favorable long-term prospects
- Presence of economic moat (basically, the company’s unique and clear advantage over its competitors)
- Favorable long-term business prospects
- Management:
- Honest and open leadership
- The company is a leader, not a follower in its industry
- Financial:Â
- Use of discounted cash flow
- High earningsÂ
- High return on equity
- Stable and high margin of profits
- Market
- Greed and fear among investors (in buying the stock)
- Use of conservative earnings estimates
Warren Buffet’s investing lessons have also showcased how qualitative principles (common sense), and not only quantitative metrics, can help us identify undervalued stocks to allow profitable, low-risk investments.
Fundamental Analysis to Identify Undervalued Stocks
Fundamental analysis refers to the analysis of financial metrics to determine the value of a stock (and whether it is currently undervalued, overvalued, or fairly valued). Here are some of the most common and important fundamental analysis techniques used in determining the value of stocks:
Price-To-Earnings (P/E) Ratio
A common metric used to determine a stock’s relative value (although it’s not the most accurate). The lower the P/E ratio of a company, the lower the price of the stock relative to the company’s profit.
Thus, a low P/E ratio may be a sign that the stock is currently undervalued. However, it’s crucial to understand the basis for the low P/E. For example, the company might not have an exciting long-term growth opportunity, so investors won’t pay a premium multiple for low growth. Alternatively, there might be an impending shift in the business cycle and analysts have yet to cut their earnings estimates for the stock.
Price-To-Earnings Growth (PEG) Ratio
A low Price-To-Earnings Growth (PEG) ratio is considered a strong sign for undervalued stocks, and PEG is also considered more accurate than the P/E ratio. The PEG ratio is essentially the P/E ratio divided by the company’s expected rate of growth.
For example, if the company’s P/E ratio is 10 and the stock has a projected earnings growth rate of 20%, the PEG ratio is 0.5. The lower the PEG ratio, the higher the company’s potential for growth, signifying that the stock may be currently undervalued.
Discounted Cash Flow
Projecting a company’s future cash flows and analyzing these projections to determine the company’s current true value. This is a very popular form of fundamental analysis that can be used to determine the intrinsic value of a stock
Dividend Discount Analysis Model
This analysis model focuses on analyzing and comparing a target company’s current and projected dividend payments to determine the true value of a stock.
Price-to-Book Ratio
“Price†here refers to the company’s total market capitalization, while “book value†refers to total shareholder equity (assets minus liabilities = shareholder equity). A low Price-to-Book ratio may indicate that the stock is currently undervalued, although we’ll still need to identify the real value of the company’s tangible and intangible assets.Â
For example, a building property is considered a tangible asset, while intellectual property (like a film) is considered an intangible asset. In this case, a film production company may own a film intellectual property that is worth more than the building it owns.Â
When using this metric, investors should be careful in identifying the actual value of the company assets.
The Value Trap
Finding undervalued stocks to invest in would require enough experience and knowledge about the company itself, the industry it’s in, and the market itself. There are many cases when stocks can appear to be undervalued when it’s actually fairly priced, and vice versa.
This is known as the value trap.
For example, based on the fundamental analysis you’ve performed, a stock may have shown all the signs of an undervalued stock: low P/E and PEG ratios, low Price-to-Book ratio, and so on. However, after the stock is purchased, it doesn’t perform as the investor expects based on the analysis.
In a value trap situation, the stock is actually fairly priced (or in some cases, actually overvalued), although the signs pointed that the stock may be undervalued. Due to this fact, the stock’s value may not go up over time, and basically, the value investment fails. There’s also the possibility that the stock’s value declines so you may need to sell the stock at a loss.
Identifying Undervalued Stocks: Step-By-Step
While there are various methods you can use to determine the value of a stock and whether it’s currently undervalued, here we’ve designed a basic step-by-step guide you can use to select undervalued stocks.Â
Step 1: Narrowing Down the Selection PoolÂ
Before anything else, you should reduce the number of stocks you’ll analyze to save resources and time (and improve accuracy).Â
Eliminate companies that currently experience governance issues and a deviation between profits and cash flows.Â
Then, analyze the earnings quality of the company (how well the company’s current earnings can predict the company’s future. There are many ways to analyze earnings quality or Quality of Earnings (QoE), but the most common indicators are:
- Inconsistencies and deviations between cash flow and profits (i.e., frequent related-party transactions)
- A high percentage of promoter shares pledged. The smaller the quantity of promoter-held shares being pledged, the better.
- Inconsistent dividend payments
- Inability to deliver results on time to shareholders
- Unstable earnings ratio (PE ratio, one-off charges, etc.)
- Irregular depreciation charges
The basic idea is to eliminate companies that manipulate their accounts in one way or another, have cash flows that don’t reach investors and have complex balance sheets in general.
Obviously, you can use other criteria of elimination depending on the target stocks and other factors. The purpose of this step is to reduce the number of available investment options to ensure the next steps are more manageable.
Step 2: Evaluating Quality Stocks
Now that you’ve reduced the list of stocks to analyze, the next step is to analyze the remaining stocks and select the best investment opportunities.
We can use various methodologies and criteria here, as we’ve discussed above, but here are some common metrics and ratios you can focus on:
1. Current Ratio
The Current Ratio refers to the ratio between the company’s current assets and current liabilities, so to get this number you simply divide the company’s assets by its liabilities. This ratio is useful to measure the company’s financial health and to determine whether the company can pay its debt obligations.Â
2. Price-to-Earnings Ratio (P/E)
Discussed above, the P/E ratio can be calculated by dividing the company’s current share price and its earnings per share. On the other hand, you can calculate the company’s earnings per share by dividing a company’s profit by the number of outstanding shares pledged.
The lower the P/E ratio is, the stronger the sign that the stock could be currently undervalued.Â
3. Price-to-Earnings Growth Ratio (PEG)
To calculate PEG, simply divide the P/E ratio by its earnings growth rate.
A low PEG ratio is a strong indicator that the market is currently underestimating the company’s potential to grow, and so the stock is potentially undervalued.Â
4. Return on Equity (ROE)
A high ROE over the long term is a strong sign that the company uses its available capital effectively to grow. Thus, the higher the company’s ROE, 15% or higher in the long term, the better and healthier the company’s performance is.
You can calculate ROE with the following formula:
ROE= {Revenues – (Expenses + Tax)} / {(Average Assets) – (Average Liabilities)}
A high ROE will also translate into a better Quality of Earnings (QoE), which is also an important metric to determine whether a stock is currently undervalued.
5. Price-to-Book Ratio (P/B)
You can calculate the Price-to-Book ratio by dividing a stock’s current market price by its equity per share. A P/B ratio that is less than one may be a sign of an undervalued stock since it suggests that the share is currently trading below the intrinsic value of its assets.
6. Debt-to-Equity Ratio (D/E)
D/E ratio will help measure how reliant the company is on debt when compared to equity to finance its operations.
The Debt-to-Equity ratio can be calculated by dividing the amount of debt the company currently has, and you can calculate it by dividing the total amount of debt of the company by its shareholders’ equity.
Step 3: Analyze Dividend Yield and Cash Flow
If the company pays dividends, then you should also analyze the company’s dividend yield, as well as its current cash flow to validate whether the stock is indeed undervalued.Â
A high dividend yield suggests that the company is profitable, but the company’s cash flow (and other metrics like debt payment history) will determine whether this dividend yield is sustainable.Â
When trying to find undervalued stocks, you should look for stocks with a consistent dividend yield and cash flow. A company that consistently and regularly pays out its dividend despite a fairly low share price is a sign that the stock could be currently undervalued.Â
Step 4: Analyze the Financials
The better you understand the company’s financials by reviewing items like the income statement, balance sheet, and cash flow statement, the better you can understand the company’s financial performance and whether its performance is sustainable.Â
In general, you should look for companies with steady and consistent (or better, growing) financial performances with minimal debt, and yet the stock price isn’t increasing. This is a strong indicator that the stock’s potential hasn’t been recognized by other investors, causing its undervalued state.Â
However, the company’s financial position is always relative to its competitors, as we’ll discuss in the next step.
Step 5: Analyze Competitors
Another basic way to identify whether a stock is currently undervalued is to look at other companies in the same sector.
If you think a stock is currently undervalued, analyze other similar companies that sell at a higher price, and analyze what causes the stock’s price to be lower than its competitors. You should also validate whether these competitor companies are currently accurately valued (it’s possible that they are currently overvalued) to prevent a value trap.
Step 6: Analyze Price-to-Book Ratio
In value investing, it’s crucial to make sure not to overpay for an undervalued stock, even if all indicators have suggested that the company is well-managed and is currently undervalued. If the stock’s price is still currently too high, it might not be a good value investment.
In general, the company’s Price-to-Book (P/B) ratio shouldn’t be higher than 1.5 times the average P/B ratio of the sector, or else it may be currently overvalued. So, it’s important to first identify the average P/B ratio of the sector/industry, which can vary a lot between different sectors.
Ensuring the stock has a low P/B ratio relative to its sector can help you easily identify undervalued stocks.
Conclusion
Accurately identifying undervalued stocks and value investing opportunities can be easier said than done, or else everyone would be doing it right away.Â
Patience and careful analysis remain the most important keys to success if you want to invest in undervalued stocks. The better you understand how to identify stocks that may be undervalued (as we’ve discussed in this guide), the easier it will be for you to use a value investing strategy to manage risks and maximize profitability.
How to Get Into Stocks: A Beginner's Guide to Stock Investing
Thinking of investing in stocks as a first timer but don't know where to start? You've come to the right place.
Stocks have been a very popular investment instrument for decades, and not without reason: they have consistently beaten the performance of any prominent asset class, be it real estate, bonds, or others, by a wide margin.
Since 1926, stock investing has returned nearly 10% on average per year, showing how it deserves its place in any long-term investment plan.
However, although stock investing is definitely profitable, starting to invest in stocks can be quite a confusing task if you are just starting out. Yet, whether you have $100,000 in capital to get started or will only start with $10 every week, you can invest in stocks, and this is where this guide comes in.
Without further ado, let us begin this guide from the basics.
The Basics of Investing: Why Should I Invest My Money?

What, actually, is investing?
In layman's terms, investing is making your money "work" for you so that it makes even more money without needing you to do anything.
While your investment returns probably won't be bigger than your day job's salary (at least, not initially), unlike you, your money can work 24 hours a day, 7 days a week, and 365 days a year without getting sick or tired. So, if you know how to invest, your money can continuously generate money for you.
Yet, investing is not actually a luxury but a necessity due to the enemy we know as inflation.
Investment vs. Inflation
Inflation, in a nutshell, is the increase in the prices of goods and services every year. Inflation is there even in the best-managed countries in the world, and nothing is exempted from housing, food, electronic goods, and other necessities and comforts.
Inflation essentially causes our money to lose its value.
Let's use something popular as an example to illustrate inflation: the iPhone.
Back in 2012, you could get a brand new iPhone 5 at just $649, while the cheapest flagship iPhone (not the SE, Mini, or refurbished iPhone) we can get in 2022 is the iPhone 13 128GB at $799. We can even argue that the direct replacement of the 2012 iPhone 5 is the iPhone 13 Pro, which is priced at $999.
While the actual calculation can be complex, let's keep it simple and say that the iPhone experienced inflation of:
($799/$649) -1 x 100% = 23.11% in 10 years
Meaning if you had an annual salary of $50,000 in 2012, and your salary has not increased by 23.11% in 2022, you technically 'lose' against inflation. If you stop working? Then inflation will move you financially backward even more.
The good news is that we can fight inflation by investing.
A successful investment practice is when you can earn a return on your investment above inflation, and although this can be easier said than done, stocks are one of the best investment instruments for achieving this dream.
Why Should I Invest in Stock?
Convinced that you do need to invest but still not sure whether investing in stock is your best bet?
Of course, there are many investment instruments available aside from the stock market, and keep in mind that you don't have to pick just one investment. Diversifying your investment and putting your money in a wide variety of investment instruments to minimize your risks is a prudent approach.
Yet, there are at least two reasons why investing in stocks is considered the best long-term option:
1. Better economic performance
The first reason is fairly obvious, and as discussed, the stock market has historically given higher average returns over the past century compared to other major asset classes: real estate, saving accounts, bonds, mutual funds, and more.
Investing in stock will not give guaranteed returns. Nonetheless, long-term investment in the stock market has more potential for returns with low associated risks.
2. Stock investing encourages financial literacy
Investing in the stock market is a little more technical than, for example, purchasing real estate or making a bank deposit, and it requires more responsibility.
In short, investing in the stock market forces you to learn more about the stock market itself, as well as macroeconomics and microeconomics, and how companies work. Ultimately, you'll have a chance to improve your financial literacy.
Investing in stocks will help you grow as an investor and learn how to manage your money better and, especially, how to create wealth.
What is a Stock?
What, actually, is a stock? When you own a stock of a company, you essentially own a small piece or a share of the company.
As an owner, every stock share you own entitles you to a percentage of the company's assets and profits.
Not all businesses are available to invest in in the stock market. Only those companies that have publicly listed their stocks through an IPO (Initial Public Offering) are.
The Stock Market
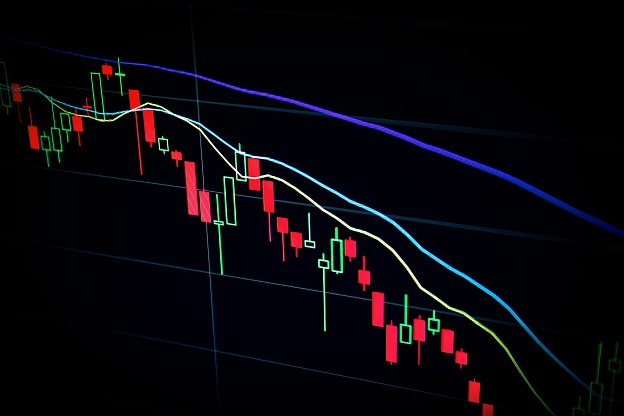
The stock market or the stock exchange is a place where you can buy or sell shares of stock of publicly listed companies. The New York Stock Exchange, Nasdaq, and the London Stock Exchange are just some examples of prominent stock exchanges, and there are many others around the world.
Today, thanks to technology, we don't need to physically go to these stock exchanges to buy or sell shares. Technically, there are only select representatives, the stockbrokers, who can directly buy and sell shares of stock in these stock exchanges, and we just transact with these brokers.
In practice, a single stock market transaction involves three interactions between four different parties:
- Investor
- Trading participant (a broker or dealer)
- The stock exchange
- The publicly listed company selling the stock
These three interactions are as follows:
- Between the publicly listed company and the stock exchange: the stock exchange evaluates, screens, and accepts companies who would want to become publicly listed.
- Between the stock exchange and the trading participant: the stock exchange assigns brokers or dealers to interact with the public, enabling buying and selling of shares.
- Between the trading participant and the investor: the broker becomes the intermediary between the stock exchange and the investor (you) for the buying and selling of shares.
How Do You Make Money in Stock Investing?
Most asset classes only allow you to make money via price appreciation (price increase.) For example, if you purchase real estate, then you can expect to make money from the house by selling it at a higher price to another party, probably after waiting a few years until the price has increased.
In stock investing, however, you get another source of gain in the form of dividends.
1. Making money through dividends
By purchasing a stock, you are buying ownership of businesses, so you are entitled to get dividends.
The dividends are, simply put, the payments a company makes to share profits with its investors. For example, a company may declare a dividend to be distributed for $1 per share. If you owned 1,000 shares of the company's stock, you'd get $1,000 in dividend payments.
Why would the company be encouraged to keep declaring dividends? Not only do they do this to encourage stockholders (you) to keep investing in the company, but there are also internal stockholders (i.e., founders) in the company, and by declaring dividends, they are also paying themselves.
2. Profits from price appreciation
The second way to make money in stock investing is through price appreciation (also called capital gains).
Price appreciation simply means the stock you own is now worth more than when you first bought it. For example, Apple's stock in April 2021 was worth $60 per share. Now, in August 2022, Apple's stock is worth $160 per share, a difference of $100 or an increase of 266.6%.
If you bought 100 shares of Apple in April 2021, then, and sold them in August 2022, you would have made $10,000 in profits in price appreciation.
How to Get into Stocks

How Much Time Do I Need to Spend?
Interested in finally investing in the stock market but not sure if you have the time?
The good news is that you technically can be a stockholder and spend no more than 1 hour per year in the stock market.
While you can be a day trader and spend more than 8 hours per day buying and selling stocks (which we don't recommend for everyone), various studies have suggested that there's little to no relationship between the amount of time you spend buying and selling stocks to the amount of money you can make from stock investing.
The potential profits you can make from the stock market are more likely determined by the quality of investment knowledge and experience. In fact, 90% of successful millionaire investors in the US are not active traders at all, and 32% of them hold their stocks for more than six years on average.
How To Start Investing in The Stock Market
There are basically three options to get started investing in the stock market, each with its own unique characteristics and benefits that may better fit your style of investing and financial objectives:
1. Through a professional stockbroker
A stockbroker or dealer, as briefly discussed above, is a licensed professional who is assigned by the stock exchange to facilitate the buying and selling of stocks for you, and they are also licensed to give you professional advice on your investments.
Partnering with a good and reliable broker means you also gain access to useful advice that is custom-tailored to your investing needs, risk profile, and financial objectives. They can provide advice on what stocks to buy, when to sell and may notify you of upcoming opportunities.
Depending on your needs, you can even let the brokers completely manage your portfolio for you.
However, this professional advice and personalized service typically will cost you higher trading minimums and higher commission rates than the other two options.
2. Purchasing Equity Funds
Another way to invest in stocks is through Equity Funds, which is a specific type of Mutual Fund (or hedge fund) that invests in the stock market.
A Mutual Fund is essentially a collection of money pooled from many investors that is professionally managed by a fund manager or a firm.
By purchasing an Equity Fund, you are not buying specific company stocks but shares of this specific Equity Fund.
If, for example, this Equity Fund is invested in 20 different US tech companies, then your money is also invested in these companies.
A key feature of investing in Equity Funds is that you are transferring the decision-making responsibilities to the fund manager or firm you trust, so you don't need to decide what stocks to buy and when to sell. This can help you minimize risks as long as the Equity Fund is trustworthy.
However, a key downside is that you don't get any freedom/flexibility, and your portfolio's performance is tied to this Equity Fund's performance.
3. Via an online platform
Thanks to technology, now it's possible to invest in the stock market via an online stockbroker, allowing you to buy or sell stocks on your own, as long as you have access to the internet.
With these online platforms, you basically do everything by yourself. Since there are minimal personalized services, you typically pay a relatively low commission rate (and no rate at all with some transactions).
Some platforms and online brokers may still provide you with reports and market information, but you typically won't get any one-on-one advice.
How to Pick a Platform or Stockbroker
If you are just starting out, we'd recommend investing with an online platform or online stockbroker due to the minimum amount to start and low commission rates.
Besides, investing with these online platforms means that you are on your own, so you can learn more before getting a mutual fund or dealing with a traditional stockbroker/advisor.
Nevertheless, you should pick an online platform or stockbroker that fits your investing needs and objectives, and you should consider these three factors:
- Reputation and reliability: make sure the platform or online stockbroker is registered with the Stock Exchange in your area (and it's not a fraudulent person or company.) If you are not sure, the Stock Exchange's website should have a list of online and traditional brokers registered with them.
- Fees and commission rates: every time you buy or sell your stocks, the stockbroker or platform will get a certain percentage of that amount. Rates can vary from broker to broker, and besides commission rates, there can be other fees like VAT, stock exchange transaction fees, sales tax, and so on.
- Reports, market information, and advice: different online platforms and stockbrokers may offer different levels of information and advice. However, typically the more information you get (especially personalized information), the more they'll charge you in fees.
How To Pick The Right Stocks to Invest In
While there are various techniques and methods investors can use in deciding which companies to buy, there are two popular (and effective) stock analysis methods you should first focus on: technical analysis and fundamental analysis.
Technical Analysis
Technical analysis refers to estimating the future value of a stock by reviewing historical data, mainly via price history and charts.
Technical analysis only focuses on analyzing price history, with a key assumption that everything that has happened and is happening is already factored into the stock's price, so other factors like political, microeconomic, macroeconomic, market psychology, and others can be ignored.
In short, in technical analysis, you only consider the price of the stock, as opposed to the fundamental analysis that would take a lot of factors into account (more on this later).
However, despite only taking price data into account, technical analysis is much more complex than it looks and would require you to really understand the supply and demand forces in the stock market.
Technical analysis is typically used in short- or medium-term stock investing, where you can exploit opportunities when stocks are believed to be trending up or down.
Fundamental Analysis
The fundamental analysis technique, on the other hand, analyzes various underlying factors that may affect the company's business performance and growth, to determine the stock's intrinsic value and whether it is currently undervalued or overvalued.
Fundamental analysis would take a look at various macroeconomic and microeconomic factors surrounding the company, including:
- The company itself: a thorough understanding of the company you are evaluating. In this digital age, it's relatively easy to gather information about a company by visiting its website and social profiles, as well as studying publicly available reports and statements of the company.
- Analyze financial statements: a thorough evaluation of the company's financial situation (revenue, expenses, operational costs, cash flow statements, profit/loss statements, balance sheet, and so on). Assess whether the company's financial situation is healthily growing year by year.
- Competitive analysis: evaluate a company's performance compared to its competitors.
- Evaluating debt: a stock of a company with a lot of debt may not perform as well as the stock of a company with little or no debt, even if the other financial factors look healthy. In general, investors should look for a company with a debt-to-equity ratio of less than 1.
- Longevity: Evaluating whether a company is future-proof (i.e., whether its product/service would still be in demand 20 years in the future, expansion plan, diversification plan, etc.).
Common Stock Investing Strategies
There are three basic strategies for stock investing. Here we will discuss each one and why they work to help you decide on which strategy will fit you better:
1. Buy and hold
Pretty self-explanatory, the buy and hold strategy involves buying stocks and holding them until you need to get the money someday.
You virtually ignore the ups and downs of the market and invest for the long-term with this strategy, and the typical approach is to pick giant enterprises and established companies.
The advantage of this strategy is that it's stress-free and very easy to use, but the potential return might be lower overall.
2. Dollar cost averaging
In this type of strategy, you are investing a fixed amount of money in the same company at fixed intervals (i.e., the same date every month), regardless of the current price of the stock.
The idea is that by buying at a fixed interval with a fixed amount of money, you spread out the risk of buying too high and too low, averaging the long-term cost so you can take advantage of the price fluctuations.
This approach has a lower potential risk but higher potential profit than the buy-and-hold strategy but would require more discipline.
3. Market timing
Also known as stock trading, this strategy involves actively watching the stock market and timing the market to buy low and sell high.
The market timing strategy obviously requires more skill, time, dedication, and luck. While trading is a lot more exciting than long-term investing, it also involves more risk.
In fact, many would consider market timing as a form of gambling rather than investing.
Conclusion
If you are just starting to invest in stocks, keep in mind that you can start small, and many online stockbrokers will allow you to invest with relatively small minimums. You can use this opportunity to learn and hone your experience before making bigger investments.
The key to successful stock investing is to do your homework first: determine your financial objectives, risk profile/risk tolerance, budget, and especially perform your fundamental and technical analysis.
Once you've done your homework, investing in stock can put you in a very advantageous position to reward yourself financially in the years to come.
How to Invest in Commodities
For anyone new to the commodities space, here is a little color on a few broad areas to help provide an overall big picture of things. Topics we will touch on include:
- What are commodities?
- Where do commodities trade and background on the exchanges
- What main areas commodities break down into
- Some examples of commodities used
- Tracking commodities
- How you can invest in commodities
What Are Commodities?
The Organization for Economic Co-operation and Development (OECD) definition:
Commodities are goods and services normally intended for sale on the market at a price that is designed to cover their cost of production.
This includes all goods and services produced by industries, all imported goods and services except direct purchases abroad by government and households, and that part of the gross output of producers of government services and a private non- profit services to households which is sold on the conditions, characteristic of sales of commodities.
Business dictionary:
A reasonably interchangeable good or material, bought and sold freely as an article of commerce. Commodities include agricultural products, fuels, and metals and are traded in bulk on a commodity exchange or spot market.
A more general definition:
Commodities are tangible items that people use to turn into energy, to make things with and to eat. More on this later. Commodities are things such as oil, gold, copper, corn, coffee, and orange juice.
Where Commodities Trade and Background on the Exchanges
Commodities have been around forever. Some say that the first futures trade happened 6,000 years ago in China, when rice futures traded. Some sources show that futures trading dates back to the 17th century in Japan, also when rice futures were traded.
Since commodities is such a massive topic, we will just focus on commodities that trade in financial markets.
1848: The very famous Chicago Board of Trade (CBOT) was formed in 1848. The CBOT originally traded only agricultural commodities such as wheat, corn, and soybeans.
The CBOT was created to help farmers and commodity consumers manage risks by removing price uncertainty from agricultural products such as wheat and corn. The Midwest grain market was chaotic, and the CBOT made the grain markets more sustainable, allowing farmers to get more fair prices throughout any given year.
1882: The New York Mercantile Exchange (NYMEX) was then formed in 1882, beginning as the New York Butter, Cheese and Egg Exchange.
1898: The Chicago Mercantile Exchange (CME), also known as “the Merc†was founded in 1898 as the Chicago Butter and Egg Board, an agricultural commodities exchange.
1919: Chicago Butter and Egg Board becomes Chicago Mercantile Exchange CME Clearing House
1933: The Commodity Exchange, Inc (COMEX) was first founded through the merger of four smaller exchanges based in New York: the National Metal Exchange, the Rubber Exchange of New York, the National Raw Silk Exchange, and the New York Hide Exchange.
1994: The Commodity Exchange Inc. merged with the New York Mercantile Exchange (NYMEX), known simply as COMEX.
2018: Today, the Chicago Mercantile Exchange Group (the CME Group) is the world's leading and most diverse derivatives marketplace. The CME Group is headquartered in Chicago.
The corporation was formed by the 2007 merger of the Chicago Mercantile Exchange (CME) and the Chicago Board of Trade (CBOT). On March 17, 2008, CME Group announced it had acquired NYMEX Holdings, Inc., the parent company of the New York Mercantile Exchange and Commodity Exchange, Inc (COMEX).
Now, the CME Group’s exchanges include the Chicago Mercantile Exchange (CME), the Chicago Board of Trade (CBOT), the New York Mercantile Exchange (NYMEX) and the Commodity Exchange (COMEX).
In addition to these changes, the industry also got rid of floor trading (aka pit trading).
As a result, there are no actual closing prices.
After they got rid of pit trading, what they used to call closing prices, they now call settlement prices. However, the trading never stops.
Commodities Break Down Into Three Main Sectors
- Energy (crude oil, natural gas, heating oil, gasoline, jet fuel, coal, propane, ethanol)
- Metals (Precious metals: gold, silver, platinum, palladium; Base metals: copper, aluminum, zinc, tin, lead, nickel)
- Agriculture (Grains and oilseeds: corn, wheat, soybeans; Soft commodities: coffee, sugar, cocoa, milk)
Examples of How Commodities Are Used:
- Crude oil is used to make oil-related products such as gasoline, jet diesel and heating oil
- Natural gas is used to generate electricity (electric utilities buy natural gas as an input to make this electricity. The other main commodity electric utility companies use to make electricity is thermal coal)
- Gold is used to make jewelry
- Silver is used to make jewelry and many industrial products (Almost every computer, mobile phone, automobile, and appliance contains silver)
- Copper is used in building construction, electrical equipment, and transportation equipment, among many other things
- Steel is used to make cars, skyscrapers, bridges, and many other structures
- Iron ore and metallurgical coal are the two main commodities that are used to make steel
- Platinum and palladium are used in catalytic converters in cars
- Zinc is mainly used to coat and protect steel from corrosion
- Grains such as corn are primarily used as feed cattle. Wheat is used as feed cattle as well. Wheat is also used to make breads, baked goods, and many other things. Some corn is also used to make ethanol.
- Other soft agriculture commodities, such as sugar, coffee, rice, and cocoa, are used for more straightforward reasons
Tracking of Commodities
Here are seven main commodity indices out in the market:
- The S&P Goldman Sachs Commodity Index (S&P GSCI) tracks 24 commodities (RELATED ETF = GSG)
- The CRB Index (Thomson Reuters/CoreCommodity CRB Commodity Index) tracks 19 Commodities
- The Bloomberg Commodity Index tracks 22 raw materials of energy, agriculture, and metal products
- The Continuous Commodity Index (CCI) tracks 17 different commodities (RELATED ETF = GCC)
- The Dow Jones-UBS Commodity Index tracks 20 commodities (RELATED ETF = DJP)
- The Dow Jones Commodity Index Series is a measure of 20 commodities
- The S&P World Commodity Index tracks 22 commodity futures
The problem is that none of these indices include all traded commodities, and each has a different weighting structure.
The S&P GSCI is the most tracked commodity index. As S&P says, "The widely tracked S&P GSCI is recognized as a leading measure of general price movements and inflation in the world economy."
However, the CRB Index is the most popular.
To have a visual of what commodities are in a popular commodity index like the CRB Index, let’s list its holdings here for more color.
The CRB is made up of 19 commodities, including aluminum, copper, gold, wheat, silver, heating oil, corn, orange juice, natural gas, lean hogs, sugar, coffee, cocoa, soybeans, WTI crude oil, RBOB gasoline, cotton, live cattle, and nickel).
The S&P GSCI holds 24 commodities, including WTI crude oil, Brent crude oil, heating oil, RBOB gasoline, gasoil, natural gas, aluminum, copper, nickel, lead, zinc, gold, silver, wheat (Chicago and Kansas) corn, soybeans, coffee, sugar, cocoa, cotton, lean hogs, live cattle, and feeder cattle.
In the case of the CRB, the index doesn't have a related ETF like the S&P GSCI does, or like the Continuous Commodity Index or the Dow Jones-UBS Commodity Index do.
How You Can Invest in Commodities
- Through futures contracts
- Through related ETFs/ETNs
- Through companies that have exposure to related areas
Futures - that’s a whole other topic due to the higher risks involved.
The most common way the public invests in/trades commodities is through related ETFs and individual stocks of companies with a concentration in commodities or businesses that cater to the needs of commodity producers.
How to Invest in Dividend Stocks
Dividend Investing is a popular and highly effective stock investing strategy, and yet many beginning investors do not truly grasp the concept of investing in dividend stocks; in fact, many do not understand what a dividend is and how it works in relation to an investment.
In this guide, we will discuss all you need to know about dividend investing and especially how to invest successfully in dividend stocks. By the end of this guide, you will have learned about:
- What is a dividend, and what is its role in stock investing?
- The concept of dividend stocks
- Dividend yields and how to assess dividend stocks
- Potential risks to dividend investing and how to tackle them
- How are dividends taxed?
- Effective dividend investment strategies you can try
Let's begin this guide from the basics.
What Are Dividends?
A dividend, or to be exact, a dividend payment, is the distribution of a company's earnings to its shareholders. We can think of dividends as a reward paid to the shareholders for their investment in a company's stock.
Dividend payments are typically paid out of the company's net profits. In most companies, the majority of the profits are kept within the company as retained earnings (which will be used to fund the company's business activities), but some can be allocated as dividend payments.
Ideally, a company will pay dividends when it is adequately profitable, but in some cases, companies may still make their dividend payments even when they don't make adequate profits to keep their reputation in making regular dividend payments.
In most cases, dividends are paid in cash, but dividend payments can also be issued as shares of stock or other forms.
Stocks of a company that issues dividends are called dividend stocks, but other than companies, mutual funds and ETFs (Exchange Traded Funds) can also pay dividends.
How often are dividends paid on stocks?
Dividend payments can be paid annually, quarterly, monthly, or other time periods. However, the vast majority of U.S. companies with dividend stocks issue quarterly dividend payments.
How Dividend Stocks Work
Now that we've understood the basic concept of a dividend, how does a dividend stock work?
Let's use an example to explain the concept of how a company pays dividends to its stockholders.
Let's say company X issued shares of stock worth $20 now, and each share earns a dividend of $0.20 quarterly.
An investor buys 100 shares of company X's stock (for $2,000), so over the course of a year, this investor would receive $80 in dividend payments ($20 each quarter). In this case, company X's stock produces a dividend yield of 4% (each dollar invested in its stock would yield $0.04.) We will learn more about dividend yields and how much of a dividend yield is considered good or bad later on in this guide.
Once an investor has received a dividend payment, they can either spend the money (including for buying stocks in a different company), reinvest the money to buy more shares of company X, or simply save the cash.
Dividend's Role in Stock Investing
A key perk of investing in dividend stocks is that the investor would receive dividend payments regardless of whether the company's stock price goes up or down (as long as the company continues to make dividend payments).
This means that by investing in dividend stocks, you'll introduce predictability to your portfolio.
Not every company that regularly disburses dividend payments will be able to maintain their dividend payout regardless of their profits and economic situations. Having a diversified portfolio of dividend stocks can minimize your risks and produce reliable income, regardless of the economic environment.
When managed properly, earnings from dividends can contribute to your total investment returns and allow your portfolio to perform better than the market.
How Investors Can Collect dividends
As mentioned, many companies (especially U.S.-based companies) usually pay their dividends quarterly.
The company's board of directors will make its decisions regarding the dividend payment schedule and other dividend policies. The decision will then be relayed to investors/stockholders through an SEC filing or a press release.
For dividend stocks, investors must pay attention to some key dates:
- Dividend announcement date: the day the company's board of directors announces its dividend plans. The stock's price may be significantly affected after this announcement.
- Record date: the deadline to purchase the stock. Only investors who are recorded as shareholders as of this day are eligible to receive dividend payments.
- Ex-dividend date: shareholders purchasing the stock as of this date will not receive the next dividend payment. Typically, the stock's price will go down on this date.
- Payment date: the day dividend payment is made.
Dividend Investing: Terms and Metrics You Need to Know
Before investing in dividend stocks, it's important to understand the following terms and metrics so you understand how to evaluate the potential performance of each stock.
1. Dividend Yield
The dividend yield, also called the dividend-price ratio, is a key metric in dividend investing and refers to the amount of dividend paid per share annually divided by price per share (in percentage).
If a company pays $1 in dividends per year while the stock costs $30 per share, then the dividend yield is 3.33%. The higher the dividend yield, the 'better' the stock is when it comes to dividend investing. However, we must also pay attention to other metrics when evaluating the stock, like whether the high dividend payout is sustainable or, even better, gradually increasing year by year.
Keep in mind, too, that a high dividend yield may also be suspicious, and you'll need to evaluate other factors.
2. Dividend Aristocrats
The term 'dividend aristocrats' refers to a group of companies that are:
- Members of the S&P 500
- Must have successfully increased the annual dividend per share for at least 25 straight years
- Must have an average daily trading amount of at least $5 million
- Must have a float-adjusted market capitalization of at least $3 billion
Investors can purchase the S&P 500 Dividend Aristocrats ETF (NOBL) to easily purchase dividend aristocrats companies and add a reliable source of income to their portfolio.
As of March 2022, there are 65 dividend aristocrat companies, including well-known companies like IBM, Walmart, and others.
3. Dividend Payout Ratio
Not to be confused with the 'cash dividend payout ratio,' which we will discuss later, the dividend payout ratio is the dividend divided by the company's earnings per share (on percentage).
If, for example, a company has a net income earning of $2 per share and pays $1 in dividends per share, then the company has a dividend payout ratio of 50%.
The lower the dividend payout ratio, the more likely the company can maintain the regular dividend payment and vice versa.
4. Cash Dividend Payout Ratio
The ratio between the dividend payment and the company's free cash flow (total operating cash flows minus capital expenditures).
Various non-cash expenses can cause a company's earnings to vary from time to time, so this metric should be compared to the standard dividend payout ratio to more accurately evaluate the dividend payment's sustainability.
5. Earnings Per Share (EPS)
The EPS metric is used to normalize the company's earnings to its per-share value.
For example, if the company has $1 million in net earnings, and has 1 million shares currently being published, then this company's EPS is $1.
Companies that can regularly and sustainably increase their EPS over time (and effectively raise their dividend payments) are considered healthy. Evaluation of a company's EPS growth is arguably the most important thing you should do when considering different dividend stocks.
6. Price-to-Earnings Ratio
Price-to-earnings ratio, or P/E ratio, is the ratio between the company's share price with earnings per share (EPS).
If the company's stock is currently priced at $10 and has an EPS of $1, then the company has a P/E ratio of 10.
P/E ratio is useful when evaluating whether a stock's price is currently fairly valued.
7. Total Return
The total sum between the amount of dividends paid and capital gains (increase in stock price).
If, for example, an investor purchased a stock at $10 per share and got $1 in dividend in a year while the stock's price also increased to $12 in the same period, then the investor got $3 in total return or 30%.
Evaluating Dividend Stocks
Arguably, the dividend yield is the most important metric to consider when evaluating dividend stocks, but it's a common mistake for beginning investors to simply buy stocks with the highest dividend yields without factoring in other important metrics.
It's important to understand that a high dividend yield is not everything, and in fact high yields can be caused by a decrease in stock price due to the risk of a lower dividend payment, a phenomenon we call the "dividend yield trap."
It's crucial to carefully evaluate a dividend stock beyond simply looking at dividend yield, and here are some important considerations you should have:
- If a stock has a significantly higher dividend yield than similar companies, it can be a major red flag.
- Study the company's balance sheet: cash, debt, asset/liability ratio, and evaluate whether the current dividend yield aligns well with the company’s financial situation.
- Evaluate the company's dividend history, especially year-by-year dividend yield and payout growth, to measure sustainability.
- Use the payout ratio metrics we have discussed above to further measure the dividend's sustainability.
Again, remember that a high dividend yield doesn't always tell the whole story. It's typically better to buy a stock with a lower dividend yield but with solid fundamentals rather than a high-yield stock with sub-par performances on other important metrics.
It's often more profitable to focus on dividend growth rather than dividend yield alone.
Investing in Dividend Stocks: Your Options
There are three basic options for investors looking to invest in dividend stocks:
1. Individual company stocks
Pretty self-explanatory, investors can simply purchase stock in a company that pays dividends. With this approach, the investor will have the most freedom in choosing the stocks in which they would like to invest. At the same time, the investor should first perform a thorough evaluation of each stock while considering the metrics we've discussed above (and more.) Maintaining a diversified portfolio can be challenging in the long run.
2. Mutual funds and ETFs
For investors who are looking for an easier approach to building a diversified portfolio, then investing in ETFs and funds with high dividend yields can be a viable option.
Dividend Investing Strategy: Best Practices
In dividend investing, there are actually relatively few strategies to consider.
The basic principle in developing a dividend investing strategy is about minimizing the risk of a dividend cut.
It's important to always remember that it is not the obligation of any company to pay its dividend, unlike paying interest on debts. When the company's profitability is at risk, for example, it's possible for the board of directors to announce a dividend cut.
This is why it's crucial to carefully evaluate the company's ability to regularly and consistently increase its dividend (dividend growth) rather than simply evaluating yield.
In this section, we will discuss five important best practices to maintain when developing a dividend investing strategy:
1. Evaluate the business's underlying performance
In dividend investing, it's important not to solely focus on dividend-related metrics but rather to evaluate the company's performance as a whole.
Remember that by purchasing the company's stock, you effectively become its owner, and so you should evaluate the company's performance as an owner, including but not limited to:
- Analyze the company's financial statements. Assess how much revenue and profit it made last year, how much debt it has, and what its cash flow looks like.
- What is the company's business strategy, and how is the company currently executing this strategy?
- How are the company's direct and indirect competitors performing?
- How much the company is retaining its profits.
- The overall situation of the company's industry today and in the short-term/long-term future.
- Analyze relevant metrics to evaluate the company's capabilities in generating future profits and dividends.
By carefully analyzing the company's performance rather than focusing on share prices and dividend payments-related metrics, you can be more objective in evaluating a stock's worth and avoid the yield trap.
2. Determine the stock's fair value
One of the keys to successful stock investing (not just dividend investing) is to make sure you are buying the stock at a fair value, so it's crucial to have a good idea of what the business is currently worth.
How do we determine a business's value? While we can evaluate many different factors, the most important thing is to assess the business's ability to return the shareholder's investment.
Meaning, one of the best ways to assess a stock's value is to evaluate its future dividends potential. Long story short: measuring the fair value of the business is about estimating the sum of its future dividends, even decades in the future.
To do so, there are three main metrics we'll need to factor in:
Dividend Size
For example, let's say we are comparing two stocks: one from company X and another from company Y.
Company X pays $100 in dividends per year in a ten-year period ($1,000 in total), while company X only pays $500 over ten years.
Which of these two companies is more valuable? Obviously, company X, with its larger dividend payment.
The larger the dividend size, the higher the fair value of the business, although you'll still need to pay attention to the two other metrics.
Timing of dividend payouts
Let's say company A pays $100 in dividends this year, and company B pays $100 in dividends, but you have to wait five years.
It's always better to receive dividends early since the longer you have to wait for a dividend payment, the less present value it will be. So, the earlier a company pays its dividends (and more frequently, if possible), the higher the fair value.
Regularity of dividend payments
For example, in a 10-year period, company X pays dividends five times, or 50%, while company Y pays dividends seven times in 10 years.
In this case, company Y has a higher fair value since you have a higher (70%) chance of getting dividends each year, while with company X, we might get dividends paid only 50% of the time.
The higher the regularity and certainty of dividend payments, the higher the business's fair value is.
3. Use value investing considerations
While there are some core differences between dividend investing and value investing, it's crucial to also use main value investing principles when choosing your dividend stocks, especially to ensure there's a significant margin of safety, the gap between the current price and the stock's fair value.
Use value investing principles to determine whether the current share price is low, high, or fair. Ideally, you'd want to purchase a stock when it's priced below its fair value (low), but at the very least, make sure not to buy when the price is high.
Why is this important in dividend investing if we are going to focus on dividend payments as a source of earning?
Imagine the following scenarios. Let's assume we are going to buy stock from a company that will always pay $100 in annual dividend in an unlimited time period.
- If you buy the company at $1,000 per share, then you'll get 10% in dividend income. This is considered excellent.
- If you buy the stock at $2,000, then you'll get 5% in dividend income. Not bad, but not as good as 10%.
- If you buy the stock at $5,000 per share, then you'll only get 2% in dividend income.
As we can see, the gap between the purchase price and the fair value (margin of safety) will ultimately determine the ROI of your investment.
However, keep in mind that you can only estimate fair value, and you won't be able to get a 100% accurate assessment. It's important to keep your estimate realistic, or else you may miscalculate the actual margin of safety.
4. Diversify your portfolio
In investing, the idea behind diversification is fairly simple: don't put your eggs in one basket.
If, for example, you put 100% of your money in a single company and the said company goes bust, then you'll lose all your money. However, if you put 10% to 10 different companies, then if one company goes bust, you'll only need the rest of your investments to grow by 10% to cover the losses.
Creating a diversified portfolio is ultimately about reducing your exposure to various risks, and you should diversify based on three layers:
1. Diversify across companies
For example, you may decide that owning one meat supplier company is too risky, so you buy ten different meat suppliers, all are U.S. based.
This approach will protect you from cases like when one meat supplier went bankrupt, so you'll only lose 1/10th of your total portfolio. However, keep in mind that if there's a situation that affects the whole meat supplier industry, then diversifying across multiple companies won't protect your portfolio.
2. Diversify across industries
Instead of owning ten meat suppliers, you'll better manage your risks if you spread your investments across different industries (i.e., restaurants, technology companies, etc.)
3. Diversify across locations
To further reduce your exposure to risks, you may also want to diversify across different geographical locations. Nowadays, building a portfolio that's diversified across different geographical locations is fairly easy, so this should be an option you should consider.
Wrapping Up
Accurately identifying investment opportunities in dividend stocks can be easier said than done, or else everyone would be doing it right away. This is why it's very important to learn from the best and improve your knowledge first.
Looking to learn more about making money from stocks? Here at Briefing.com, there are more than enough lessons to get you started and help you learn at your own pace.
How to Invest in Stocks: A Simple Guide
The U.S. stock market has a history dating back more than 200 years, so it has a lot of history. Some of it is bad, but fortunately for long-term investors, most of it is good. The historical average annual return for the stock market, measured by the S&P 500, is approximately 10%.
That average includes years when the S&P 500 has declined 20% or more, which is to say the stock market doesn’t go up every year. You can lose money in the stock market, but history also shows that the stock market has been a great wealth-generating machine for patient-minded investors.
The S&P 500 tracks the 500 largest companies that trade on stock exchanges in the U.S. and includes companies that operate in 11 economic sectors: communication services, consumer discretionary, consumer staples, energy, financials, health care, industrials, information technology, materials, real estate, and utilities. The S&P 500 is a market-capitalization weighted index, meaning the biggest stocks (in terms of their value, not their stock price) have more influence in dictating the daily performance of the S&P 500.
According to S&P Dow Jones Indices, to be eligible for inclusion in the S&P 500, a company should be a U.S. company, have a market capitalization of at least $11.8 billion, be highly liquid, have a public float of at least 10% of its shares outstanding, and its most recent quarter’s earnings and the sum of its trailing for consecutive quarters’ earnings must be positive.
So, how does one get started investing in the stock market? Below we offer a simple guide to that process.
- First, you need to have a good understanding of your risk tolerance. Would you be comfortable remaining invested if your investment went down 30% or more? Is a 10% loss the most you can stomach? These are questions only you can answer, but they are the foundation for understanding the types of stocks you will feel comfortable investing in.
- Determine what you want out of the stock market? Everyone wants to make money in the stock market, but there are different ways to make it. Money can be made through capital appreciation (i.e., rising stock prices) and money can be made through dividend payments (i.e., money companies pay to their shareholders, typically on a quarterly basis). Some companies provide both options: capital appreciation and dividend payments.
- Determine your investment goal(s). Is it for a down payment on a house? Is it to save money for college? Is it to help fund your retirement years? The answers will give perspective on your holding period and the types of stocks/investments that will improve the potential for meeting your investment goals.
- Understand that not all stocks are the same. There are growth stocks, which are stocks of companies that are projected to grow well above the average growth rate of the market. Growth stocks tend to offer higher returns, but with higher returns comes higher risk. Briefing.com publishes a list every Monday of the top 25 small-cap and mid-cap growth stocks in the market on our Emerging Growth Stocks page, using a quantitative screening process that removes emotion and bias from the stock-picking process. There are value stocks, which are stocks that trade at prices below their fundamental value or long-term growth potential. Even so, it can take a while to realize that value, making them a potential “value trap†for investors who might suffer an opportunity cost by holding a depressed value stock for an extended time while other stocks go up in price. Briefing.com publishes a Value Leader Rankings table every Wednesday to our Stock ideas page. The rankings are derived from a proprietary screening method that helps investors avoid value traps. There are also income stocks, which are stocks of companies that typically don’t grow very much and offer less capital appreciation potential but have dependable earnings that enable a regular dividend payment. Each Friday Briefing.com publishes a Yield Leader Rankings table to our Stock ideas page that helps investors identify companies that offer a combination of dividend income and capital appreciation potential. Access these investment ideas and more with a Briefing Investor subscription.
- Do your research. Learn about companies first before investing in them. What do they do? Do they sell only in the U.S., or do they have international business? Who are their competitors? Who are their biggest customers? What are their growth trends and opportunities? Answers to these questions can be found in SEC filings, which are typically available for free on the investor relations site of publicly traded companies. Specifically, you would want to read the 10-K SEC filing to learn about a company’s business operations, and supplement that reading with other sources of information like the company’s annual report and earnings press releases. In turn, Briefing.com, with its daily Story Stocks coverage, and investment columns that cover emerging growth, value, income, and IPO ideas, is another useful source for learning more about companies that trade on U.S. stock exchanges. Try a Briefing.com subscription service to access company research, investment ideas, and trading calls.
- Look at statistical data that gives insight on sales, earnings, and cash flow trends This information can also be found in SEC filings that contain a company’s income statement, balance sheet, and cash flow statement. There are also free sites like Yahoo! Finance that provide a snapshot of this information.
- Find a broker that can help you make your investment. That can be done through a full-service broker like Morgan Stanley or Goldman Sachs, but these full-service brokers can have high limits for making an investment through them. A financial advisor can also be a helpful resource. Just be sure to understand the fees they charge for their services. There are many reputable online sources now that offer investment assistance without any limits. They also offer an ability to make investments on your own or with the help of a registered agent with zero or very low commissions. This would include companies like Charles Schwab, Fidelity, E*Trade, TD Ameritrade, Interactive Brokers, and Robinhood. In addition, these brokers, and the full-service brokers and financial advisors, provide a suite of research services and investment screening tools that will help identify suitable investment opportunities based on your risk tolerance and investment goals. You will also find analyst ratings on individual stocks that involve specific buy, sell, or hold recommendations.
- Keep learning. Investing in a stock isn’t the end. It’s just the beginning. Follow your investment by following the company and its competitors.
How to Make Money in Stocks: An Ultimate Guide
Is it possible to make a living from stocks? Can we consistently "win" and make a profit trading stocks?
Since the creation of the New York Stock Exchange back in the late 1700s, the dream that you could quit your day job and support yourself just from the profits you gained from stocks has been sought after by so many people all over the world. And the good news is, it's actually possible.
However, just because it's possible to make money from stocks doesn't mean it's easy. And doing it consistently, in the long run, is even more difficult, if not impossible. In fact, studies have suggested that the majority of day traders actually lose money over the long term.
So, how can we make money from stocks? Is HODLing the only way to consistently make profits?
In this guide, we will answer those questions (and more), and we'll also discuss all you need to know about making a living from stocks. By the end of this guide, you'd have learned about:
- How stocks work (and how to make money from them)
- Three basic ways to make money in the stock market
- Investing vs. trading
- Best practices to invest in stocks and make money
- Common mistakes made by stock investors
How Stocks Work
Before you can make money from stocks, either by investing or trading, we have to first understand how stocks work or, to be exact, how owning stocks works.
What does it actually mean to own a stock? When you buy a share of stock, you technically become the owner of the company publishing the stock.
Let's use a fictional company as an example to illustrate stock ownership:
The YYY Company has a revenue of $100 million with a net income of $10 million. The YYY company then sells its stock to the public in an IPO (Initial Public Offering), typically with the help of an investment bank.
In this fictional scenario, the company creates 500,000 shares and sells them for $40 each. So, the YYY company's net profit ($10 million) is divided by 500,000 shares. So, each share of stock in YYY company is allocated $2 of the company's profit. This is known as EPS, or Earnings per Share.
Meaning, if you've purchased 100 shares of YYY company worth $4,000, you'll be buying $200 in annual profit per year, on top of the future growth or losses generated by YYY company. If, for example, YYY company can grow its revenue by three times in 2 years, then your share of profits could also be three times higher ($6 per share), making the stock a great long-term investment.
However, in practice, YYY company's board of directors and management team can take several different options about the profits the company has generated, and their choices may impact your earnings as a stockholder. Here are some of those options:
- The company may decide to send cash dividends to shareholders; they may also decide whether to use the whole profit as dividends or just parts of it.
- The company may decide to repurchase its shares to increase its internal equity. You, as a stockholder, may choose to sell your stock at a higher price in this case and make a profit.
- The company can sell more stocks and then reinvest the funds to expand the business, for example, by hiring more employees or building more stores.
- The company may build up liquid assets or reduce debts to improve its balance sheet (which may also increase the stock's price).
Three Basic Ways To Make Money in The Stock Market
Now that we've understood how stock ownership works, we can see that there are actually many viable ways we can make money from the stock market.
However, all these different methods can be differentiated into just three basic ways:
- Collecting dividends: as mentioned above, many companies pay cash dividends to their stockholders. Dividends are typically issued quarterly, and although typically paid in cash, sometimes companies may offer additional shares of stock.
- Selling at a profit: the classic stock trading strategy, buy low, sell high. The goal of this method is to purchase stocks when the price is still low and then sell the stock when the price has gone up.
- Short selling: this method is technically the reverse of "buy low, sell high" and is typically performed by borrowing shared stock from a broker or other lenders, selling them on the market, and then buying them back later when the price has gone lower. This way, you can return the stocks to the lender while keeping the margin. Essentially with the short-selling strategy, you are betting that the stock will decline in value.
As we can see, in theory, there are always ways to make a profit from a specific stock, whether it's currently increasing, staying, or declining in value. However, knowing which strategy you should take and when to actually cash out and take the profit can be easier said than done.
Ultimately, making profits from stock depends on two key factors:
- Risk tolerance: how much money they can risk vs. how much profit they want to earn
- Time horizon: how long an investor can afford to wait for the stock to generate profit.
Greediness and waiting too long before cashing out are common mistakes made by many investors and traders. Below, we'll discuss the important best practices to have when investing in stocks so we can avoid these mistakes (and more).
Important Best Practices When Investing in Stocks
1. To Consistently Make Profits, Stay Invested
While it's possible to make money trading in the stock market in the short term, the only way to consistently make money is via the compounding investment return you earn by holding the stocks on a long-term basis.
The stock market's average return on investment is 10% annually (although the rate is reduced by inflation), which is still better than most bonds or interests you'll get from the banks. Yet, many investors fail to earn that 10% average profit because they don't stay invested long enough.
On the other hand, don't underestimate the compounding returns you'll get in the long run, even if you've invested only a small amount.
If, for example, you've invested $10,000 and the stock increased by8% for the year (not counting the dividends, etc.), then you'd gain $800, turning your investment into $10,800 in total. Reinvest this $10,800 for another year, and it will 'grow' to $11,664. Keep this stock for ten years, and it will grow to more than double your initial investment ($21,589).
It's important to understand that while the average stock market return, as mentioned, is historically 10% annually, in reality, stock performances can vary day by day. So, if you are investing only in the short term, the risk and volatility would only be higher.
After accounting for inflation, a diversified stock portfolio can return an average of 6% to 7% annually. So, stay invested and aim for the long term.
2. Invest regularly
Not only investing for the long term is key, but to maximize compound investment return, you should continue to invest regularly.
Let's expand on the same example we've used above: let's assume we start with a $10,000 investment, but then we continue to add another $10,000 contribution every year (that is, around $200/week). In such cases, the effect of the compound return will be exponentially amplified than simply purchasing a stock and forgetting it.
Fortunately, there are now many apps and solutions that can help investors in scheduling their regular contributions. In fact, you can also leverage your 401(k) account to automate the process, for example, automating the account to take a specific amount each week or each month.
3. Diversity is key
The thing is, no stock will consistently perform, no matter how good the fundamentals are. Thus, investing in stocks (and investing in general) always carries risk: some of the stocks you invest in may underperform the following year, or even worse, the company you invest in may close down.
With that being said, it's very important to diversify your portfolio, and as the old saying goes: don't put your eggs in one basket.
By ensuring you're invested in different stocks (preferably in different types of sectors/industries, you'll be better prepared for the worst and can minimize your risks.
4. Consider getting professional help
While it's true that the digital age has made it easier to invest in stock and build your own stock portfolio, hiring an investment advisor will always have its perks.
Yes, they will not guarantee 100% success and eliminate all risks of losses, but they can help you minimize the risks. Fortunately, nowadays, there are many affordable investment advisor options, including apps and robo advisors. Identify your needs and your budget, and choose your options accordingly.
5. Have a financial plan
Before investing in stocks, it's very important to first build a financial plan, especially for two things: knowing your investment goals and your risk tolerance.
What do you want to accomplish at the moment? And how can your stock investment help in achieving these goals? Understanding your financial objectives, as well as your risk tolerance, can significantly help in choosing the right stocks to invest in, as well as in identifying an investing strategy that works for you (more on this later.)
Only after you understand your objective and your risk tolerance can you develop a proper asset allocation plan and implement the right strategy.
6. Start as early as possible
Again, the more time you stay invested, the more potential you can make profits from your stocks.
The earlier you start investing, not only can you maximize the compounding investment return of the stock (as discussed above), but you'll also maximize the opportunity to buy the stock at an average cost in the long-term (which will help you minimize your risks.)
In fact, someone who invests $100 per month in stocks from ages 20 to 30 and then stops, can actually make more profits than someone who starts at 30 and invests $100/month until they retire at the age of 65.
Start early, and invest regularly.
7. Invest in what you understand
It's crucial to understand that you don't really need an overly complex and sophisticated investment strategy to consistently make money from stocks.
Instead, the important thing is to understand the sector, industry, and the particular company you are going to invest in so you can understand how it currently performs and what the future may look like for this company.
Again, don't let emotions hinder your long-term investment objectives. Many investors make the mistake of investing in companies that sell products/services they like and use (i.e., investing in Apple for iPhone users.), while good products don't necessarily mean a good investment opportunity.
While not everyone may have the time or expertise/experience to analyze the nuances surrounding a company, it's important to at least understand the basics of how a specific stock in a specific sector can be considered a good investment.
Investing in Stocks: Mistakes To Avoid
While there are obviously many mistakes made by stock investors and traders all over the world, here are three of the most common and important ones:
1. Trying to make short-term profits
A very common mistake made by investors is to let their emotions (especially FOMO) interfere with their long-term investment strategy: an "insider" leaked that the stocks of company A will increase by 50% in a week, and you purchased the stock based on your emotions.
On the other hand, it could be very difficult to keep holding shares of stock when the market is crashing, despite the fact that throughout history, the stock market has always recovered.
It's never a good idea to try to time the market. Instead, we'd recommend investing regularly over the long term.
2. Not understanding (and paying attention) to your risk tolerance
Another very common and potentially fatal mistake made, especially by beginner investors, is not understanding and/or respecting their risk tolerance, resulting in them taking too little or too much risk; both can be detrimental.
If an investor takes a higher level of risk than their risk tolerance, they may be tempted to cash out sooner than the ideal timeframe, and they may not be able to resist cashing out in the midst of volatility.
3. Following trends too much.
Too often, investors are tempted to buy the hottest stocks at the moment or the biggest new IPO. However, as mentioned, it's very important not to follow your emotions when investing, and it's generally recommended not to pick and choose individual stocks but rather to maintain a diverse portfolio.
To avoid this mistake, we'd recommend beginner investors consider investing in index funds instead, which are made up of a diversified mix of stocks (and sometimes, bonds.) This can help prevent investors from cherry-picking individual stocks and lower the overall investment risks in the long run.
Effective Stock Investing Strategies and Tips
Based on the best practices above (while avoiding the mistakes we've discussed), below, we will discuss some proven strategies you can use to make money in stocks:
1. HODLing
The classic buy-and-hold strategy remains the most effective strategy to make money in stocks consistently.
As the old saying among stock investors goes, "time in the market beats timing the market", the basic idea behind the HODLing strategy is fairly simple: if you stay invested long enough, you'll eventually be profitable.
While there's certainly no guarantee, and you may still lose money despite buying and holding shares of stock for, let's say, ten years, sensibly staying invested is the most effective strategy to minimize this risk.
The more frequently you buy and sell stocks, the more risks you'll either buy or sell at the wrong time (buy when the price is too high and sell while the price is too low). With the HODLing or buy-and-hold strategy, you only buy and sell once, so you'll effectively minimize the risk.
2. Reinvesting cash dividends
As mentioned above, many companies pay their stockholders with cash dividends, a periodic payment (typically quarterly) based on the company's earnings and profits.
If you only own a small percentage of shares, then the amount you'll get in dividends may not seem lucrative at all. However, don't underestimate the potential profits you'll get from reinvesting these dividends.
The basic idea here is simple: with the reinvested dividends allowing you to own more shares, your earnings will compound even faster.
Check your stock brokerage offers Dividend Reinvestment Plans (DRIPs), which are essentially a feature investors can use to use their dividends to purchase fractional or whole shares of a stock at no added cost (typically commission-free).
Alternatively, you can choose to receive the dividends in cash and then use the money to purchase either the same stocks or securities manually or purchase different stocks to diversify your portfolio.
3. Make adjustments when necessary
While we've repeatedly recommended the importance of having a solid long-term investment plan and sticking with it, it doesn't mean you cannot adjust and rebalance your portfolio when needed.
Yes, you shouldn't try to time the market, but you should make adjustments to your portfolio to stay aligned with your original objective and investment plan.
For example, if your original plan is to use the popular 60/40 strategy (sticking in a portfolio consisting of 60% stocks and 40% bonds), but in the past few months, bonds have performed poorly while stocks have been showing massive gains, then your portfolio may not stay 60/40 as intended. So, you might want to adjust by selling some of your stocks and/or buying more bonds to return to your original plan.
Regularly evaluate your portfolio and monitor its performance against your original strategy and objectives, and make adjustments when necessary.
4. Consider funds over individual stocks
It's important not to overestimate your ability to predict which individual stocks will increase in price in the future. Yes, obviously, if we can identify the next Tesla and invest all our money in it, we'll get massive gains, but most investors and even the so-called "experts" will not be able to do it consistently.
This is why we'd recommend investing in exchange-traded funds (ETFs) or mutual funds to help you diversify your portfolio and lower your risks instead.
Most stock experts recommend investors invest in funds that track major indexes (i.e., Nasdaq or S&P500), which are easy and cost-effective for most investors to diversify their portfolio quickly.
5. Value investing
Value investing is a strategy popularized by Warren Buffet, and is essentially centered on finding undervalued stocks (at least, stocks the investor/analyst believes are currently undervalued), so they can make profits from them once the stocks climb in price.
In the value investing principle, a stock is considered undervalued when it doesn't fully reflect its intrinsic value, which is possible because the stock market isn't always rational (i.e., there are investors who trade based on trends or emotions).
These irrationalities, according to the value investing theory, give birth to opportunities for investors to get undervalued stocks at a discounted price, allowing them to make money from them.
While traditionally, value investors must analyze the financial data of the companies they'd like to invest in, nowadays, there are value mutual funds that can allow investors to bypass the need to analyze stocks.
The Russell 1000 Value Index is an example of such a fund, and there are also other index funds designed for value investors.
Remember, however, that value investing can only work when the investor commits to the long-term, so use it in combination with the HODLing strategy.
Wrapping Up
While it's definitely possible to make money by investing in stocks consistently, it's still important to use the right principles and strategies, or else you may lose money.
Accurately identifying undervalued stocks and investing opportunities can be easier said than done, or else everyone would be doing it right away. This is why it's very important to learn from the best and improve your knowledge first.
Looking to learn more about making money from stocks? Here at Briefing.com, there are more than enough lessons to get you started and help you learn at your own pace.
How to Predict If a Stock Will Go Up or Down

The last few years saw quite a bit of volatility in the stock markets. And while some enjoyed amazing gains because of rising stock prices, others failed to predict the future price and suffered losses. And with major global events continuing, only those with a keen understanding of how to identify the right individual stocks will be able to enjoy success.
Finding the right stocks to invest in is a key part of success in your financial strategy. But while there are thousands of experts claiming to know the secret to discovering the next winner in the stock market, figuring out whose advice to follow can be tricky.
In fact, the only way to have more confidence about the stock picks you make is to learn how to recognize the right stocks, identifying the key signs that can help you predict which stocks are going to go up and down. But how can you learn to read the financial market and understand the direction that the current prices of stocks will head? And what can you learn from the price history when trying to make more informed decisions?
Let's explore these and other important questions below.
Can You Predict Stock Prices?
Before we can get into the more technical aspects of the price movements in the market, it's important to answer the primary question - can you reliably predict future price trends in the first place? After all, while it's relatively simple to see why certain stocks rise and fall in retrospect, using the same principles to make stock market predictions doesn't always pan out.
Well, the most important thing to understand is that even if some would like you to believe otherwise, not even machine learning can guarantee the accuracy of future share prices with any reliability. In fact, despite advances in technology and impressive models, the basic principles of supply and demand are just a fraction of the infinite amount of factors that can come into play.
Some people have a much better track record than others. And using the right clues to make decisions while simultaneously weighing your risk tolerance for any given option can give you a much better chance of success.
It's also important to understand that success can mean different things. For day traders, success is defined by making a short-term profit because of the changes in a stock's price. However, for those investing in the long-term, the indicators of a worthwhile stock might be completely different.
But to have a good chance of succeeding consistently, you must have a solid understanding of the factors that can impact a stock's price increasing or decreasing.
Reasons a Stock Might Go Up
There are quite a few signs that could be pointing to a stock price increase. Even though these signs are by no means definite, they can serve as an indication that the market price of a share might increase in the upcoming time period.
Volume
One of the biggest indicators of how a stock is going to perform in the future is the volume of trades. When a stock surges in volume, that, at the very least, means some type of interest increase is happening, and that can often correlate with events that will positively impact the future price.
However, to make the most accurate predictions about whether a stock's price will increase, it's important to understand volume and use it the right way.
Taking volume alone might not be enough to make a confident decision about what's going to happen with a stock. but at the same time, it can be a very powerful confirmation of a future breakout, especially if you already have other indicators that are telling you a stock is poised to head in an upward direction.
You can also use volume to decide between a few stocks that are showing promise. If you see a stock price movement that could indicate a surge, the volume of trades for that stock can tell you that there's significant interest in the stock and allow you to confirm that it's not a false rally.
At the same time, trading volume can be a great sign if the surging price is about to come to an end. If the volume is decreasing, the price trend may be slowly coming to an end and could even be reversing, which is something you will need to consider before committing.
Moving Averages
Moving averages are an excellent way to see a clearer picture of how a stock is performing. It's especially useful when trying to cut through the noise and short-term volatility of a stock and identify the underlying trends in the price history that will give more insights over a longer time period.
A moving average is basically a way to create a smoother and more even view of a stock's price over time. It takes a time period, such as 10 days, 30 days, or even 200 days or more, and uses a moving average of that period to provide an average price at any given time.
So, for instance, you could look at the data from the last 200 days and see how the 200-day average looked, without having to deal with distractions in the form of short-term fluctuations that might not be indicative of anything relevant.
At the same time, since moving averages are much smoother and less volatile than actual price changes, the trends you do notice tend to carry more weight. In other words, if you do spot a trend in the moving averages, that can give you more confidence in believing that some type of change is taking place, providing more clarity on the best course of action in the situation.
A great way to use moving averages is to take a shorter and longer moving average (say, 10-day and 100-day), and see how they correlate. That can help you identify if the short-term trends are actually a sign of a changing tide or if the previous trend of growth is continuing.
Volatility
The term volatility typically has negative connotations because it comes with a lot of uncertainty and can be very costly to investors and the economy in general. However, for the savvy trader who is able to recognize the underlying reasons for the volatility and predict its outcomes, it can also be a golden opportunity for picking stocks that are poised for a rapid rise in value.
In fact, when the markets are relatively flat and nothing of significance is taking place, finding stocks to invest in or predicting the ones that will rise can be much more difficult.
But in order to make sense of market or stock volatility and use it to your advantage, it's crucial to understand what those fluctuations actually mean in the context you are looking at.
One of the key traits of stocks that are more volatile by nature is the number of shares available for trading at any given time. For example, S&P 500 stocks can be considered "large-cap" stocks, which means that they have millions of shares available at any given time.
To make stocks that large more volatile, one would need to buy or sell a significant percentage of the available shares, which is not easy to do and is usually reserved for the large players. Because of that, volatility is typically lower, and large-cap stocks will rarely fluctuate by more than a few dollars.
Meanwhile, on the other end of the spectrum, you have the "low float" stocks, which means that there are relatively few shares available for trading. In these instances, the supply of the available shares is much lower and that exposes the stock to more volatility in case of increased demand.
Typically, when dealing with low float stocks, you will work with companies that are still in the early stages and might not even be profitable yet. Those who manage to recognize the growth potential will try to act fast and get as many shares for a price as low as possible. And since there aren't that many shares to begin with, that can cause a rapid increase in the stock price.
By tracking the volatility of low float stocks, you can potentially recognize a stock that is seeing a lot of activity and jump on the trend, which can sometimes result in incredible returns.
Identify When a Stock Has Bottomed

The single best time to invest in a stock is when it bottoms out and reaches the lowest price it is going to have. That's where the saying 'buy low, sell high' comes from, and why it has become the ultimate cliché in the finance world.
The tricky part, however, is accurately predicting not just that the stock won't plummet anymore but that it will actually bounce back at all.
When a stock is in free fall, that means most investors have jumped ship and decided the stock is not worth the risk, with many taking significant losses just to get out of their position with as little damage as possible. And that means that there will always be significant risks when investing in stocks that are falling.
The good news is that if you know what to look for, you can mitigate many of the risks and get incredible bargains on stocks that are typically priced at a premium.
One good area to look at is the entire sector in which the company is operating. If there's a crisis that has put an entire industry in a downward cycle, you may want to hold off on purchasing even if the price is appealing, since the stocks might not bounce back for an extended time period.
However, if a stock is plummeting because of reasons unrelated to its sector and you have reason to believe that the company will pull through, you may be able to get a good bargain and see the stock price bounce back relatively quickly.
The aforementioned volume of a stock is another good indicator when deciding if a stock has bottomed out. When the volume slows down, that means there aren't that many sellers left, which can indicate that the stock is about to start stabilizing and potentially rising again.
Finally, when tracking stocks that are falling, pay very close attention to the public perception and the news surrounding it. Most investors typically overreact to the news, which can cause volatility. Still, over time, the true value of the stock wins out against any trends or media hype around a topic that might have influenced it before.
Bottom Line
The ultimate goal of all investors is to find stocks that are significantly undervalued and are about to take off. But since every single investor can't be successful, achieving the goals you set out usually comes down to being able to manage risks and work with as much information as possible when making decisions.
With the tips listed above, you should be able to find individual stocks that show good promise to increase in value. You use measures like the trading volume and moving averages, as well as various economic indicators, to make confident decisions that will pan out more often than not.
How to Protect Yourself from Downside Risk
In September 2011 the Swiss National Bank set the franc's minimum exchange rate at 1.20 per euro. In early January 2015 Swiss National Bank president Thomas Jordan reiterated that the peg was a "cornerstone" of the central bank's monetary policy. A short time later -- on January 15 to be precise -- the Swiss National Bank removed the peg, which sent the franc soaring as much as 30%. In the process, that move unleashed a world of financial hurt for traders/investors who levered up on the cornerstone of that peg.
This is all old news by now of course, but it serves as a sobering reminder that positions deemed to be inviolable can, and do, get violated, often in an abrupt manner and often at a great cost to those directly involved in the positions and, unfortunately, to those indirectly involved.
It doesn't have to be that way. Potential losses could be minimized, or even avoided, if one is hedged for the possibility of the inviolate position getting violated.
Burned By Complacency
When something seems like a sure thing, it is understandable that one might think it's simply wasting money paying for some form of insurance to guard against the thing that won't happen.
It's sort of like convincing yourself that you don't need car insurance because you've never had an accident or that you don't need home insurance because you've never had a fire. Paying the premiums every month is just throwing money out the window.
Certainly, for traders/investors who took the Swiss National Bank at its word and were lulled into complacency with a three-plus year cap on the franc, there was just no wrapping their mind around the thought that anything could go as wrong as it did.
For example, Everest Capital Global Fund, which had $830 million in assets at the end of 2014, lost almost all its money after the Swiss shocker, according to a Bloomberg report, since the fund was betting on a decline in the Swiss franc. Citigroup (C) and Deutsche Bank (DB) reportedly lost about $150 million each at the time.
An Aura About Them
We would hope that everyone learned an important lesson with the Swiss franc debacle. It showed once again how leverage, used to fire up big returns with little of one's capital at stake, can backfire in an even bigger, and quicker, way when a sure thing goes awry.
The life cycle of a sure thing can be longer in some instances than others or, conversely, it could be shorter in some instances than others.
One can never truly know. The prevailing aspect in both instances, though, is that there is heightened confidence in profiting from the position. Accordingly, there is less of an emphasis -- if there is any at all -- on protecting against downside risk.
The point is that one needs to take stock of how strongly they have embraced ideas with a sure-thing aura about them.
Are you hedged at all for an adverse turn in the conventional wisdom? Have you increased your position using borrowed money? Can you handle the losses that arise from selling that is forced and emotionally charged by others trying to stem the bleeding of their own leveraged trades? Have you accounted for any downside risk?
Between the Hedges
There are several approaches that can be used to hedge for downside risk (the same goes for upside risk with short positions, but for our sure-thing purposes here we'll keep the discussion limited to downside risk).
- Simply take some money off the table.
- Put options can be purchased to limit single-stock risk and index put options can be purchased to limit market risk.
- Stop-loss (or sell-stop) orders can be placed, which order a sale to take place at the first available market price beyond the limit order.
Note: Stop-loss orders work well in orderly markets, but don't necessarily pan out as intended in disorderly markets (which is what one often sees when sure-thing ideas are disproved) considering they are executed on the first available market price beyond the stop-loss order. Accordingly, a stock could gap down, and you could get filled at a market price well below your sell-stop order. - Stop-limit orders provide a price limit guarantee, but here, too, there is no guarantee they will get executed in a fast-moving market.
Example: You place a stop-limit order at $47 for a stock trading at $50, but if it gaps down to $45 and the order doesn't get filled, it will remain unfilled until the stock gets back to $47. - Inverse exchange-traded funds (ETFs) can be purchased that act as an offset to a long position taken in a specific asset class.
Examples for indexes:
- ProShares Short S&P 500 (SH)
- ProShares Short Russell 2000 (RWM)
- ProShares Short QQQ (PSQ)
Examples for stock sectors:
- ProShares UltraShort Nasdaq Biotechnology (BIS)
- ProShares UltraShort Semiconductor (SSG)
Examples for foreign markets:
- ProShares UltraShort FTSE China 50 (FXP)
- ProShares Short MSCI Emerging Markets (EUM)
- ProShares UltraShort Europe (EPV)
Examples for bonds:
- ProShares Short High Yield (SJB)
- ProShares Short 20+ Year Treasury (TBF)
Examples for commodities:
- United States Short Oil Fund (DNO)
- PowerShares DB Gold Short ETN (DGZ)
Example for currencies:
- PowerShares DB US Dollar Index Bearish Fund (UDN)
Please note that the ETFs listed here are not specific recommendations. They are simply held out as examples to convey the point that there are opportunities in the ETF universe that can help mitigate losses in downside moves. Please be sure to research further to determine if these ETFs, or any others, fit with your risk tolerance and investment needs.
How to Research Stocks: Guide for Beginners
Today, we wanted to answer a common question we get at Briefing.com: What is the best way to research stocks? We think the best way to tackle this question is in two parts: Finding the right stock and then, once you have settled on a name, how to research that stock.
I. Finding the Right Stock
There are many ways to uncover attractive stocks in which to invest. Different methods will work better for different investors. The key is to find a strategy with which you are comfortable. Let’s look at some of the various methods of finding the right stocks:
It is good to experiment with different parameters and different levels within parameters. We also recommend using minimum cutoffs, perhaps a $500 mln market cap or at least 100K average daily trading volume. We would also avoid bulletin board stocks as they are too risky and are too thinly traded.
Despite a bad reputation for some, analysts really know their stuff and they have good connections in the industry and with the companies they cover. Our recommendation here is to focus on the substance within their notes, which often is top notch and very valuable. We recommend paying less attention to the headline Buy / Sell rating and Target Price etc. That is more about marketing.
The one exception when you should pay attention to the headline ratings is when a company, for example, has virtually all Buy ratings and then that first analyst goes to Hold or Sell. Another time might be when that first analyst lowers their sales or EPS estimates below consensus ahead of an earnings report. That is when you want to react as an investor. That should make your ears perk up.
Briefing.com’s YIELD Leaders report is a great resource here. We publish the report every Friday afternoon on our Stock Ideas page under the Investing & Trading tab. The report provides information on companies that are being aggressive in terms of share buybacks and dividends. This report is a good resource because it does not put weight on Relative Strength like some of our other reports. So, you can find some beaten down names that make for good turnaround candidates. And if companies are willing to pony up to buy their own shares, they clearly see some value there and they would know the company best.
Be sure to set an alert for YIELD in order to get email notifications for the report. In addition to the Friday report, where we profile a name that jumps out at us, we also publish reports intermittently, so the email alert means you will not miss anything.
What we really like among IPOs are the ones that maybe timed their deal poorly, meaning the market sells off soon after IPO debut. You can find some really good names that are beaten down and, because they are recent IPOs, they may have gotten overlooked when they came public, and people forgot about them. You may be able to scoop up quality names on the cheap.
Another reason we like IPOs is because the S-1 filings with the SEC are super helpful. IPOs tend to go into a lot of detail and the language of S-1’s tends to be more everyday language and less legalese.
The best pattern: A quality name, the overall market then sells off near its debut, stock gets knocked down perhaps below the offering price and is forgotten about. We prefer to see some consolidation (trading sideways) and stabilization, then hopefully they turn around as the market improves and investors start to notice them.
An example of this is salad restaurant chain SweetGreen (SG). It made its IPO debut in November, right before Omicron and the market sell-off in 2022. But we love that set up. We profiled SG as a beaten down name a few weeks ago. It’s a good read, you should check it out.
Briefing.com also has a great IPO list under our Calendar heading. If you then click on Lock-Ups, you can see a list of recent deals. Then start punching those tickers into a charting software, or even BigCharts.com and look for good patterns.
Just be careful around lock-up expirations. That is when management is allowed to sell their shares. These sales can weigh on the stock price, although it is less of a problem for beaten down names. You can find lock up expiration information on our IPO calendar.
Finally, you can also set a ticker alert for IPOXX, then you will get email notifications of any IPO reports we publish.
You can go through the SEC filings for insider trading activity. However, we think the best way to generate ideas or track a name you’re invested in is to use Briefing.com’s INSID ticker search. Just type INSID into the ticker search on InPlay and you will get a bunch of recent data points. Also, we recommend setting up an INSID ticker alert, so you get email notifications whenever comments get posted.
Two big industries we all deal with are retailers and restaurants. That may seem simple, and they may not be as exciting as tech stocks, but you know the brands firsthand or you see how busy a restaurant chain tends to be. Rest assured that retail and restaurant stocks can be big movers as well. Not every stock you own needs to be tech related.
lululemon (LULU) is a great example. It is a great brand and the market got excited with its MIRROR purchase, then the stock headed lower as MIRROR estimates were lowered when people returned to gyms. The point here is that we all have opinions on companies and brands and that’s very helpful. Other examples we have been bullish on recently include Columbia Sportswear (COLM), Tapestry (TPR) and Sonos (SONO). We all know these brands and can make judgments about them.
II. How to Research Stocks
If you can gain or lose thousands of dollars, you can take a few hours researching the stock and company. If you divide your gain or loss by the number of hours spent on stock research, that hourly amount is likely much higher than the current salary, so take the time. And Briefing.com will help you.
The rule of thumb here is that you should be able to explain to someone else in everyday language what a company does and why you like the stock. If you cannot comfortably talk about the company with confidence or answer questions, you need to do more research on that stock. And even if you are comfortable, do more research.
Briefing.com Archive: We think a great starting point in researching stocks is typing a ticker into the InPlay archive, which will pull up all sorts of tidbits about a company. People may not realize it, but our archive is one of the most used pages on our service. The archive will provide a plethora of recent events, maybe some of our stock analysis. It will pick up key events, notable insider buys, upgrades/downgrades (although go to up/downgrade calendar also for a complete list), earnings, etc.
Call Transcripts: We think listening to the quarterly conference calls is extremely helpful. You get a lot of great information for your stock research. Some companies can be overly positive but do your best to filter out what is really important. We think the Q&A sections are very valuable because there is no pre-written script, so you can get some candid answers to questions. Everyone can listen into the calls when they happen. Be sure to get the information from Briefing.com’s Earnings calendar for time/date and the link to the webcast. If not able to listen live, paid services offer transcripts which are the easiest to use, but many companies at least provide an audio recording of the call. And some companies provide transcripts but not too many.
Company Websites: You can get a lot of information from a company’s website. They tend to provide good overviews, but they certainly may provide an overly rosy view of the company. But it is still helpful for your stock research. They also tend to provide histories of press releases in their investor relations sections.
SEC filings: The filings are great for gathering background on a company. In particular, the 10-K’s go into a lot more detail than the 10-Q’s. The 10-K is also great for discovering competitors and suppliers, etc.
We like to use P/E (current and forward year), which is calculated by simply dividing the share price by the annual EPS estimate. You can get the quarterly EPS estimate in our Earnings archive page, but there are plenty of other websites, like Yahoo Finance, FinViz.com etc., where such information can be found. Ideally, you should also take the time to compare to other competitors to see where your company comes out.
Other metrics we like to use include price/sales (especially good when a company is not yet profitable), EV/EBITDA, etc.
Briefing.com runs a VALUE Leaders report every Wednesday that generates some ideas with good valuations. Again, a ticker alert (VALUE) will help notify you when a new report is published.
Summary
What we really want investors to take away from this report is that it is important to do the leg work, find the right idea, find a good story like trends in EVs or the expected recovery in automotive production in 2022 and avoid big losses by using stock loss limits. Also, set up ticker alerts for GROWX, YIELD, VALUE, IPOXX, INSID, FUNDX. And do not be ashamed to stick to what you know and is easy to understand, maybe a retailer or restaurant chain. Those stocks move quite a bit. We hope this report on researching stocks was helpful.
Learning Your Risk Tolerance
The secret to successful investing is learning your own style: meaning what works for you. There is no "correct" approach that everyone should learn. However, everyone needs to learn how much risk they can comfortably handle. It is the single most important investment issue for long term success in the market.
What Is Risk?
For most people, risk simply means "losing money."
But many people define risk as "price volatility." This definition considers the fact that you may have to "worry your way through" some rough spots, before finally seeing a profit.
Price volatility is measurable, and the "beta" statistic gives a rough indication of how much more volatile a stock is than the overall market. A beta of 1.3 indicates a stock is 30% more volatile than the overall market. When the market rises 10%, a 1.3 beta stock can be expected to rise 13% -- but it also falls 30% more than the market as well.
Betas, however, don't measure a stock's "quantum" price jumps at all. A stock with a beta of 1.0 that reports poor earnings can still lose 50% of its value overnight.
Risk and Reward
It is a common phrase: the "risk/reward ratio." What does it mean?
The risk/reward ratio is simply shorthand for the old adage: "high reward comes with high risk."
Traditionally, the stocks that have returned the most, over the long haul, have had the greatest price fluctuations, along the way.
This simple fact is often ignored, particularly by new investors. It means you must learn to live with price fluctuations if you seek the highest rewards.
It would be great if every investment always went up, straight up, and never gave up a day's gains.
But if that type of steady advance is what you need to feel comfortable, stocks are not for you. Only bank certificates of deposit (CDs) always increase every day. Even government bonds fluctuate on a day-to-day basis.
When Risk Overwhelms
All too often, we get an email along the following line:
I bought 1,000 shares of XYZ at $42. Now it is at $32. I've lost $10,000 and my spouse wants me to dump it, but I think we should hold on. What should I do?
Unfortunately, we cannot really answer this type of email. Briefing.com is never able to give personal investment advice.
The primary reason is that we don't know your risk tolerance level.
The only meaningful way to answer such a question starts with "examining your risk tolerance." There is never any crystal ball as to a stock's future price movement. All anyone can do is balance the possibility of higher prices with the risk that higher prices will never happen.
An understanding of the possibilities of future higher prices versus future lower prices has no value by itself, however.
The understanding of future possibilities must then be balanced by how well you can handle the worst possible outcome, both financially and emotionally.
Furthermore, you also need to be able to handle the uncertainty of events along the way towards the reward fulfillment.
Any investment undertaken without a deep understanding of your own individual risk tolerance levels is, by definition, a foolish investment.
Risk Level Mismatches Are Common
When someone asks a question like in the hypothetical email above, it indicates they have chosen an investment whose risk characteristics were beyond the investor's risk tolerance level. However, in most cases, those risk possibilities were known in advance. The risk side of the equation was ignored, and when it happened, the risk mismatch became a problem.
This mismatch of latent risk becoming real, and more than your tolerance level, is not uncommon. It happens to everyone, including pros.
When it does happen, however, you only have two choices to becoming more comfortable:
- Find a way to live - financially and emotionally - with the newer risk levels.
- Get out of the situation, even if it means a "real" loss.
Hanging on to an investment simply to avoid a loss is the single most common cause of even larger losses.
Historical View on Risk
Before the stock market became a middle-class endeavor (in the late eighties), a traditional adage given by stockbrokers was "never put money into the stock market that you can't afford to lose entirely." This adage was meant to prevent people from ever encountering the risk mismatch problem.
But in the nineties, with the advent of 401(k) plans and online brokerages, the mass media began telling people: "you must own stocks; stocks always go up."
They never told people about the risk tolerance issue, however. It is the reason so many people were so hurt in the collapse of the bubble.
One Way to Think About Risk
Many people start investing using the idea that their initial investment (the check written to open the brokerage account) is the "real money" and all other unrealized gains or losses are "house money."
It seems straight forward to think this way, but this approach can be the source of great anxieties, unfortunately. It is the root of the idea that "you haven't lost if you haven't sold" - which is a double-edged sword
To handle risk, you need to come to understand two fundamental facts:
- It is ALWAYS your money.
- You WILL lose, sometimes, because loss is unavoidable.
Unless you embrace these two principles, you will eventually make the following mistakes:
- Holding on to a position with an unrealized loss, to avoid taking a "real loss," when you no longer have any premise for the stock.
- Selling at a loss a stock for which you have a reasonable premise not yet disproved, simply because the price has fallen, and your fear has overwhelmed you.
- Buying a position whose risk possibility you never even considered in advance.
If you avoid the concept of "house money," some of these issues can be avoided.
Examples
To demonstrate the problems of "house money" thinking, consider this.
Imagine the following occurs, called situation A:
You purchase $10,000 worth of XYZ.
It immediately rises to $14,000 in less than a week on no news at all.
Who can argue with this? You've got $4,000 in profits!
Now imagine scenario B:
- You purchase $10,000 of XYZ.
- It immediately rises to $14,000 on no news.
- Overnight, again on no news, XYZ falls, and your position is now worth $10,000 a week after you bought it.
Would the decline from $14,000 to bother you? For most people, it does not. Somehow, the $4,000 "lost" in the fall between $14,000 and $10,000 seems like "house" money.
Now imagine scenario C:
- You purchase $14,000 of XYZ.
- XYZ immediately then falls to $10,000.
Does situation C bother you more than situation B? It bothers most people. They simply cannot let go of the fact that they have "lost" $4,000.
But, in truth, there is no real difference between situation B and situation C.
Whether you buy at $14,000 or $10,000, when the stock is at $14,000, it's YOUR money. You have "lost" $4,000 in either scenario.
But if you can live with scenario B, you can learn to live with scenario C. In fact, if you want to succeed in the stock market, you must learn to do this. If you invest in the best growth stocks, you will eventually encounter both scenarios.
On the other hand, if both scenarios B and C bother you, you should not be buying volatile stocks. Period. You probably think the mistake causing your discomfort is "not selling when it was worth $14,000," but the truth is that the mistake was buying XYZ in the first place.
Taking Real Losses
The above example used situations where no news was involved. The story might be different in Scenario C if the fall in price came because of a poor earnings report or other event that disproved your investment premise.
If that is the case, you should take the real loss and sell, to become an "inadvertent" long term holder whose only goal is to "get back even so I can sell this dog." On such investment premises as these, fortunes larger than yours have been lost.
No One Answer for Everyone
Just as there is no right "favorite color" for everyone, there is no "right" risk level for everyone. Only you can determine what level of risk is right for you.
You need to find the right balance between the amount of risk you are willing to take, and the amount of risk you can actually take. All too often investors think they are willing to take risk, but when a loss happens, they find out that they aren't willing to take risk.
Surviving in the market long term is the most important way to make the market work for you. To do that, you need to learn your own risk tolerance ability.
If a real loss helps you to that level of understanding, and you can financially afford the loss, it can be valuable emotional tuition. Frankly, it is tuition that every experienced investor has paid, at one time or another.
Understanding the Buy-Side and the Sell-Side
The term "Wall Street" refers to the entire financial industry. But like all streets, Wall Street has two sides: the buy-side, and the sell-side. One side is quiet, the other talks all the time.
Stock Is Product
To an investment banker, stock is a product. That product is created, through an IPO, and then sold in the stock market.
The creators, and "servicers" of stock product are collectively called "the sell-side."
This includes investment bankers who bring the company public, analysts who do research on stocks and make public upgrades and downgrades on the stock, and the market makers who trade stock continually, and profit from the spread between the bid and the ask.
At an investment bank, all these functions are performed at a single institution.
Anyone associated with an institution that does all or part of these functions is said to be "from the sell-side."
Stock is an Investment
Who buys the stock that is created?
The other side of Wall Street, which manages money for a fee, is collectively called the buy-side. This includes a lot of different types of institutions and people such as money managers at mutual funds, pension funds, hedge funds, and institutional firms. Anyone who buys stock, with the intention of later selling it at a profit, is "from the buy-side."
In a general sense, the individual investor is also on the buy-side, but the term generally refers to professional money managers.
The issue is sometimes confused because investment banks also have buy-side parts to them, which manage money for others. To prevent potential abuses, investment banks create so-called "Chinese Walls" to separate their buy-side elements from their sell-side elements.
The Sell-Side Bias
The sell-side, obviously, sells stock.
Like any sales organization, the sell-side tries to get as high a price as the market will pay. And like any good sales organizations, those on the sell-side "stand behind" their product. However, unlike some other industries, they don't offer a money back guarantee.
But the sell-side does service and support its product. It does this with analysis and ratings of the stock it has sold.
This is where the sell-side sometimes gets criticized as having a bias towards "pushing" stock. However, this is where the stock industry differs from other industries. The sell-side has no real control over how well a company performs, which is ultimately reflected in the stock price.
Nevertheless, sell-side analysts try to present as positive a picture as possible for stocks they have brought to market, through analysis and research. The cynical viewpoint is that this picture is created solely to drive up the price.
What the sell-side really tries to do, however, is envision the future, just as we all do, and bring to market new stocks, as well as support existing stocks, that will benefit from that vision.
Ultimately, the sell-side bias is countered by a desire for a good reputation. A firm that continually pushes low quality companies is quickly known as such. But a firm whose sales pitch turns out to be accurate generates loyalty from the buy-side customers.
In the ideal world, every stock that an investment bank brings public becomes a great company. The analysts covering the stock predict a great future, and it happens. Everyone wins in that scenario.
The Buy-Side Silence
Although the buy-side receives a lot of sell-side research and analysis, it doesn't bank on it as a sole source.
The buy-side does its own research and forms its own vision of the future. But it doesn't share it with the world.
In fact, if the buy-side stumbles on a formula, vision, or approach that works, it keeps it secret. Wouldn't you do the same?
Upgrades, downgrades, target prices, and opinions all come from the sell-side. The buy-side keeps its opinions to itself.
But make no mistake. There are more analysts in the mutual fund industry alone than there are at investment banks. You just don't ever hear what the buy-side research uncovers.
Where They Meet
The buy-side, obviously, must trade stocks. Generally, it executes trades at the large sell-side houses.
Why? Because sell-side houses can execute large block trades. If you are a money manager, you can't trade a 100,000 block on an online brokerage system. You need to get a middleman, the sell-side broker, to prearrange a trade for you. When a 100,000-share block crosses the wire, it is the result of several phone calls, maybe hours of phone calls, to prearrange the trade between two or more parties.
The buy-side needs the sell-side for trades. The sell-side needs the buy-side to take product. Both sides together make Wall Street.
Briefing.com's Unique Role
Briefing.com is firmly planted between the buy-side and the sell-side.
We do original research and offer investment analysis and opinions. But Briefing.com does not manage money, nor do we accept fees or any payments-in-kind from companies in exchange for coverage. When we write positively about a stock, we have no position to defend or support.
Our research and stock analysis are solely designed to provide you, our only customer, with investment ideas, from which you can form your own decisions.
Like the buy-side and the sell-side, we aren't always right. But unlike both sides of Wall Street, we always have your interests as our top priority, in the hopes that you will become, and remain, Briefing.com readers.
What Are Futures in the Stock Market?
As an active investor, you manage risk and seek opportunity. But what if you could shield your portfolio from a market downturn without liquidating a single position? Or capture upside in a major index without buying a single stock?
That’s the power of futures contracts, or standardized agreements to buy or sell a specific asset at a set price on a future date. They’re more than just trading vehicles; they’re risk management tools you can leverage to offset short-term exposure or tactically position around broad market moves.
Futures 101: What Are Futures in the Stock Market?
A futures contract is a commitment between two parties to exchange an asset at a predetermined price on a specific date. These contracts trade on regulated exchanges and follow uniform terms, which makes them highly liquid and accessible.
Each contract has two sides:
- The Buyer agrees to purchase the asset at that future price. This is called “going longâ€; they profit if the market moves higher.
- The Seller agrees to deliver or settle the asset at the same price. This is called “going shortâ€; they gain if the market drops.
These contracts are used by investors who want to take a view on the market, hedge risk, or manage exposure without trading individual stocks.
Most futures tied to the stock market are based on major market indexes like the S&P 500 or the Nasdaq 100. These are known as index futures, and they represent a bet on the overall direction of the market, not ownership of any actual stocks. Think of it as trading on the score of the game, rather than on a single player.
Understanding the Risks in Futures Investing
When you trade a futures contract, you’re not paying the full value up front. Instead, you put down a margin deposit: just a small percentage of the total contract size. This setup is called leverage.
Because your small deposit controls a massive contract value, even slight movements in the underlying market lead to magnified changes in your account. For example, a modest 1% move in the S&P 500 index could translate into a 10% or 20% gain (or loss) on the cash you actually deposited.
Due to this intense sensitivity, futures accounts are marked to market daily. That means your gains or losses are realized in cash at the end of each trading session.
If the market moves against you too far, and your losses erode your margin below a certain threshold, you may be required to deposit more funds immediately to keep your position open. This makes risk management critical.
Types of Futures: Commodities vs. Financial Contracts
Futures contracts go beyond just stock indexes. They fall into two broad categories:
- Financial futures, which include index futures, are based on financial benchmarks like interest rates or currencies. These contracts are cash-settled. When the contract expires, the exchange compares the price you locked in to the final market price, and the difference is settled in cash between the buyer and seller.
- Commodity futures are tied to physical goods like oil, corn, or gold. They were originally created to help producers and buyers lock in prices ahead of time. If held until expiration, these contracts can lead to physical delivery, where the actual goods are exchanged.
What Is Futures Investing For?
Whether you’re trying to protect gains, position around economic news, or take advantage of momentum, futures offer tools that are faster and more efficient than moving your entire portfolio.
Protecting What You’ve Built: Hedging With Futures
Hedging is like taking out an insurance policy on your existing assets.
Let’s say you’re holding a well-diversified stock portfolio. You don’t want to sell your positions (you’re invested for the long term), but you’re concerned about a pullback in the next few months.
Instead of selling your stocks, you can temporarily protect their value by selling a futures contract on a major stock index, such as the S&P 500. If the market drops, the value of your futures position rises, helping to offset some of your portfolio’s losses. You stay fully invested, avoid triggering taxes, and still have downside coverage.
Acting on Market Views: Speculating With Directional Trades
Speculation means using futures to take a clear position on where you think the market is headed. Because futures are leveraged, they let you act quickly and efficiently on those views.
For example, if you’re bearish, you can sell a single index futures contract instead of shorting dozens of individual stocks to bet against the broader market. If you’re bullish, you can buy a contract to ride the upside. It’s a streamlined way to express your outlook without having to restructure your entire portfolio.
What Are Futures in Finance and Beyond: Trading Macro Events
Futures allow you to trade more than just stock indexes. You can also use them to take positions on broader economic forces, like interest rates.
Interest rate futures, for example, let you speculate on what the Federal Reserve might do next. If you believe the Fed will raise or cut rates, these contracts allow you to act on that view directly.
Instead of rebalancing your entire portfolio based on rate expectations, you can use a single futures position to reflect that macro view.
Factors To Consider When Trading Futures
Leverage is what makes futures powerful, but it also raises the stakes. A slight shift in the market can have a disproportionately large impact on your account.
In this environment, there’s no room for guesswork or delayed information. To trade futures effectively, you need a constant stream of real-time news, economic data, and expert-level market context.
Whether you’re hedging a portfolio or trading on market direction, success depends on knowing:
- What economic events are driving sentiment right now?
- What key levels are traders watching across major futures contracts?
- How are global developments moving futures markets overnight?
That’s where Briefing.com gives active investors an edge. With institutional-quality coverage, Briefing.com delivers fast, accurate updates on earnings, macro reports, central bank policy, premarket futures price updates, along with futures trading calls.
In the leveraged world of futures, information is your greatest edge.
Start your free 14-day trial of Briefing.com or subscribe now, and get the actionable market intelligence you need to trade with confidence. You can also stay informed after the bell with the After Hours Report and track individual movers through Story Stocks.
What Are Scalable Business Models?
Even though the Internet stock bubble eventually burst, one thing should be kept in mind. The Internet created the possibility of very scalable business models. Despite what happened to Internet stocks in general, the right investment in a good scalable business model could still prove to be a great investment. What are scalable business models?
Business Models
he term “business model†refers to a very simple concept: how a company receives revenues in exchange for value delivered. If you have a good understanding of a company's business model, you can understand how the earnings of a business respond to growth of the business.
To understand any company's business model, you need to ask the following questions:
- Who pays the company?
- What does the company do to deliver the value, and to whom?
- What does it cost the company to deliver that value?
- How does the company get paid when more of its services are consumed?
There are many business models where the person receiving the value is not the one paying the revenues. Broadcast television is perhaps the best example. TV is free, but advertising pays for delivery.
Although it seems like a simple concept, there were, and still are, companies that became public in the Internet boom without well thought-out business models, scalable or not.
Many Internet business models didn't pass basic tests of credibility. For example, sites with pure advertising models are usually unable to answer the most basic question about growth: how big can you get? The reason is that growth is entirely dependent upon increased page views, either by more users, or more pages, offset by declining ad rates.
Both have upper limits and most companies with advertising models have fixed costs exceeding current revenues. When you try to compute how many page views a pure advertising model needs to generate just to cover fixed costs, it is usually baffling.
Scalable Business Models
A scalable business model is also a simple concept. A scalable model is one where:
- Increased revenues cost less to deliver than current revenues
In other words, the operating margin increases as the company's revenues grow.
Technology's greatest achievements have all been associated with scalable business models.
Fixed Costs and Variable Costs
Another way to think about scalable models is to look at a company's fixed costs versus variable costs.
Fixed costs are costs that a company incurs whether it sells or not.
Variable costs are costs that a company can control, or which it incurs as it makes sales.
A company with a scalable business model will have variable costs that are small, per unit, or discretionary, as in R&D. The fixed costs should be ignored so long as you believe that revenue will be large enough to exceed the fixed costs.
Not Economy of Scale
A scalable model is not the same as economy of scale. The phrase economy of scale means that a company's variable costs become lower as the company gets bigger. In addition, fixed costs can be spread over a greater number of units sold. This helps earnings, but economy of scale does not ensure that operating margins increase as revenues increase.
Cost of Goods Sold
Another way of understanding a scalable business model is to examine the relationship between cost-of-goods-sold and revenue. Companies that have a very low cost-of-goods-sold percentage generally have an opportunity for a scalable model.
Gross margin is the difference between revenue and cost-of-goods-sold. If the cost of sales and marketing, per unit or per customer, is less than the gross margin, then the company's model is scalable. For every dollar spent on marketing, more than a dollar is generated in gross margin, provided there is demand.
Revenue, cost-of-goods-sold, sales and marketing, can all be read from a company's earnings report.
Demand
Scalable business models have the potential for earning high profits. That potential is only fulfilled when demand drives revenues up. Finding a scalable model is one thing. Finding a scalable model with evidence of booming demand is the ideal situation for an investor.
Examples
The most common example of an established scalable business model is software. Developing software costs a tremendous amount but delivering a copy of that effort costs next to nothing.
Microsoft takes the concept of scalability further than any other software company because it provides only a single image of the Windows operating system to hardware vendors. The hardware vendors absorb all the charges for developing documentation and CD-ROM copies of software. In essence, Microsoft receives revenues with zero cost-of-goods sold.
The Internet is unique in that it is creating software delivered electronically which is the best of both worlds. The application software world, where software was delivered in a shrink-wrap box, had costs associated with each unit sold.
The Application Service Provider (ASP) model delivers software at no additional cost per user. Provided that ASPs can charge for services on a per user basis, the ASP model is very scalable.
Searching For Scalable Business Models
There are two ways to search for possible investments in scalable business models:
- Look for companies that sell items with low cost-of-goods sold percentages.
- Use a stock screening database that allows you to compare the percentage increase in revenues with percentage increase in operating margin.
If you can uncover an existing company that has a scalable business model, and the market has depressed the price, it may be a great investment.
What Are Stock Options?
Stock options allow traders or investors to speculate on moves in most stocks under a specific time period. Briefing.com publishes unusual options activity twice daily because activity in the options market sometimes foreshadows movements in the underlying securities. Options contracts for equities expire on the third Friday of every month. There are two distinct types of options.
Call Options
A call option is a bullish trading position.
When a trader purchases a call option, he or she is purchasing the right to purchase stock from the seller of those call options at a specific strike price.
Each call option gives the right for 100 shares of stock. For example, if a trader purchases ten call options, he or she has a right to purchase 1000 shares of the underlying stock at the strike price after expiration.
Someone may want to sell a call option to earn some extra income by collecting the premium that is paid by the buyer of the call option. The premium is the price of an option contract, and it becomes income for the seller of the call option whether the strike price on the option contract is hit or not
Example: Let’s say that Apple is trading at $190/share before earnings and a trader purchases a December $195 call option. Apple posts a strong quarter and the underlying stock trades up to $210/share. The buyer of the call option has the right to buy stock at $195/share at expiration. He or she can sell it for a quick profit of $15/share in the open market. The seller of the call option loses in that scenario because he or she will sell shares at $195/share even though the underlying stock is $210/share. The seller of the call option, though, keeps the premium paid by the buyer of the call option.
Put Options
A put option is a bearish trading position.
When a trader purchases a put option, he or she is purchasing the right to sell stock to the seller of those put options at a specific strike price.
Each put option gives the right for 100 shares of stock. For example, if a trader purchases ten put options, he or she has the right to sell 1000 shares of the underlying stock to the person who sold those put options after options expire. If that person does not have any stock to sell, he or she will need to purchase the stock in the open market.
Someone may want to sell a put option, because they feel the stock will not go below a certain price and they can earn some extra income by collecting the premium paid by the buyer of the put option.
Example: Let’s say Apple is trading at $190/share before earnings and a trader purchases a $185/share put option. Apple posts a disappointing quarter and the stock drops to $170/share. The buyer of the put option will have the right to sell the stock at $185/share even though the underlying security is trading at $170/share. If the trader does not have stock, they can purchase at $170/share in the open market and sell at $185/share using the put option, thus making a $15/share profit. The seller of the put loses in this scenario because he or she will have to purchase shares at $185/share even though the underlying security is trading at $170/share. The seller of the put option, though, keeps the premium paid by the buyer of the put option.
Speculation
Normally traders do not wait until expiration to take profits on their option positions. Therefore, if a trader sells their current position, they have no rights or obligations at expiration (as explained above). Traders can profit on options if the value of the option increases faster than the time decay of those options. As a contract gets closer to expiration, it is worth less if the strike price is far away from where the stock is trading. For example, let’s say Apple (AAPL) Dec $200 calls were trading at $1.00 on December 1. These calls will expire on December 17. If Apple is trading above $200, those options will have value, but if Apple trades under $200 on December 17, those options will have no value.
What Are Stock Splits?
Investors have probably heard about stock splits but may not understand how they work or why companies would “split their stock.â€
A stock is split when a company decides to increase its number of shares. A basic example might be a company with 50 mln shares outstanding and a $200 stock price. By announcing a 4-for-1 split, that would result in 200 million shares outstanding and a $50 stock price. The market capitalization – or value of the company -- does not change. So, if you own 100 shares in that company, you will now own 400 shares, but the value of each share will be reduced.
There are also reverse stocks splits, but that’s usually only for very low-priced stocks. For example, a $2 stock might do a 1-for-10 reverse split, which reduces the number of shares outstanding but increases the price to $20. The idea here is that a $20 stock is seen as less speculative than a $2 stock. Also, there are a lot of mutual funds prohibited from owning stocks under $5, so a reverse split would enable them to buy the stock.
Why do a stock split?
Companies may not admit it, but the main reason is to boost the stock price. Typically, the announcement itself will give the stock a boost, plus the more lasting impact is hope that a cheaper stock price over time will entice more investors to buy the stock. A basic stock split also improves the liquidity of a stock because it increases the number of shares in circulation. However, it does not change your percent ownership in the company.
Smaller retail investors generally prefer to buy lower-priced stocks. For example, an investor with a $10,000 portfolio may shy away from buying Apple (AAPL) at $720 per share because even just a few shares would eat up a good chunk of his or her portfolio. However, Apple did a 4-for-1 stock split in August 2020 and now it’s trading around $180, which is more palatable for the average investor.
There is also a psychological aspect to it. If a $50 stock goes up $1.00, that’s a 2% move, whereas a $1.00 move in a $100 stock has less impact. We agree it should not make a difference, but some investors think this way, hence the allure of low-priced stocks for some people.
Conclusion
A stock split should have little to no impact on your investment decision as the valuation metrics do not change. However, the truth is that humans trade stocks and psychological factors do play a role in stock selection. Many people prefer not buying $1,000+ stocks. Also, we recommend that investors not make investment decisions based on the hope a company splits its stock. An investment decision should be based on the fundamentals of the company and on valuation.
You can track announced stock splits page by using Briefing.com’s Stock Splits page, which appears under the Calendar tab on the main menu.
What Are Value Stocks?
In the simplest terms, a value stock is a security trading at a lower price than what the company's performance indicates it should be worth. This determination is generally made using various valuation metrics that are then compared to a company’s peers. But it can extend to its industry in general. For example, if a stock is trading roughly in line with its industry peers, but its whole industry is trading below where it should be relative to other industries, we would qualify that as a value stock as well.
Where to Find Data
Gathering the valuation data can take a little legwork, but it’s worth the time. The easiest thing is to subscribe to paid services, like S&P Capital IQ, FactSet or Bloomberg. However, there are some good free sites as well. Finviz.com has a free screening platform. Yahoo! Finance and Nasdaq.com provide a lot of good data as well. Briefing.com’s earnings archive is also good for historical data.
You can also go old school and compile the data directly from earnings press releases. Also, some companies maintain nice tables of historical data on their websites in the Investor Relations section. The caveat here is that it’s a lot easier to find historical data as opposed to forward consensus estimates. Among the free options, Yahoo! Finance, under the Analysis tab, has some good forward consensus data.
Once you compile the data, we recommend setting up an Excel worksheet and maintaining the data as it changes over time. And that includes not just the company you’re interested in, but also its competitors which can be found in 10-K filings on the SEC Edgar website.
Valuation Metrics
There are lots of valuation metrics people use, here are some of the more common ones:
- Price/Earnings: This is simply the stock price divided by adjusted earnings per share (annual) for the current year and forward year.
- PEG Ratio: The idea here is to compare P/E ratios relative to their earnings growth rates. For example, assuming two companies trade at a P/E of 20x, but one is growing EPS by 10% and the other by 20%, the PEG ratios would be 20/10 or 2.00x and 20/20 or 1.00x, respectively. The lower the PEG ratio, the cheaper the stock relative to its earnings growth. A ratio below 1 suggests a discount.
- Price/Sales: Here, you take the company’s market cap and divide it by LTM sales, or current year sales or you can use forward sales as well. P/S is typically used for companies that are not yet profitable, oftentimes they are startups or perhaps recent IPOs.
- EV/EBITDA: Enterprise value (EV) is the total value of a company, including debt. You can calculate using market cap + cash + ST and LT debt. The drawback on just using market cap is that it reflects only the equity side of the balance sheet whereas EV looks at the whole company, including its debt. EBITDA is a profitability metric we think should be used more because it backs out depreciation which is a non-cash expense and is a better proxy for cash flow. Many companies provide EBITDA numbers, but you can calculate by starting with operating income (EBIT) and adding depreciation & amortization (DA).
In sum, valuations are always important in all industries and all market environments.
Briefing.com Valuation Resources
We highly recommend compiling the data and running valuation screens. But you can also utilize Briefing.com, which runs weekly screens that you can use as a starting point for your research. On Wednesdays, we publish our VALUE Leader rankings, which is a proprietary quantitative system that combines multiple valuation factors with above-average Relative Strength. On Fridays, we publish our YIELD Leader rankings, which focuses more on share buybacks and dividends. YIELD is not a pure valuation screener, but companies spending money on their own stock is a great indication that insiders think their stock is cheap. YIELD has uncovered some big movers over the years.
Access Briefing.com’s value stock analysis and coverage with a subscription to a premium service.
What Beta Means: Everything You Need to Know About Measuring Stock Volatility
Investing is certainly not easy, and any investor should always prepare themselves for the rocky roads along the way.
With that being said, one of the biggest factors differentiating a savvy investor from a speculator is their ability to assess risk. When an investor is successful in assessing risk in the stocks that they buy or sell, they can find an ideal time to trade their stocks, improving their gains.
While there is no 100% surefire method to assess a stock's risk and value, one of the most popular and effective techniques investors can use is beta.
Yet, what is beta, and how does it work? How can investors use beta to assess a stock's risk?
In this guide, we will answer all important questions related to beta and also discuss all you need to know about measuring stock volatility. Let us begin from the basics.
What is Beta in Stock Investing?

Beta is a type of statistical measure that can be used to measure a stock's volatility in relation to the market (i.e., S&P 500) it is in or to an alternative factor.
Let's use an example to further illustrate how beta works.
Let's say we're going to use beta to compare an individual stock within the S&P 500 index. As the market, the S&P 500 index has a beta of 1.0, and there are two alternative situations for individual stocks within the index:
- An individual stock that moves more than the S&P 500 index has a beta above 1.0
- An individual stock that swings less than the market has a beta below 1.0
The basic assumption is that the higher the beta of an individual stock, the riskier it will be to own this stock. However, this high-beta stock will also have a higher return potential.
Vice versa, an individual stock with a low beta is less risky but also has a lower return ceiling.
Beta and the CAPM
Beta is actually a component of the Capital Asset Pricing Model (CAPM,) which is a model describing the relationship between systematic risk and the expected return of stocks (or other assets.)
The formula for calculating the expected return of a stock given its perceived risk with CAPM is:
ERi=Rf+βi(ERm−Rf)
Where:
ERi=expected return of investment
Rf=risk-free rate
βi= beta of the investment
(ERm−Rf)=market risk premium
The Rf (risk-free rate) is the theoretical rate of return of the stock investment when zero risk is assumed. This is typically calculated by subtracting the Treasury bond matching the stock investment's duration with the current inflation rate.
In the CAPM model, the investor is assumed to be taking additional risks to achieve higher returns, which is accounted for by the other components: beta and market risk premium.
Beta, as discussed, is the measure of how risky an individual stock is when compared to a market, while the market risk premium is the return expected from the market above the risk-free rate.
The CAPM formula is pretty accurate in evaluating whether an individual stock is currently fairly valued when compared to its expected return after considering additional risks and the time value of money.
For example, an investor is evaluating whether a stock worth $50/share is worth buying.
The stock currently pays a 2% annual dividend with a beta of 1.25 compared to S&P 500. Meaning, this individual stock is riskier than the S&P 500 index.
The risk-free rate is assumed to be at 2% and the market is expected to rise in value by 6% per year.
Using the CAPM formula ERi=Rf+βi(ERm−Rf), we can calculate the expected return of this stock:
ERi=2%+1.25% x (6%-2%)
ERi=7%
In this example, the expected return of this stock is 7%, based on the CAPM formula.
How to Calculate Beta
To reiterate, beta in stock investing is the risk (or volatility) of an individual stock when compared to the volatility of a market portfolio (or the entire stock market.)
The beta of individual stocks is widely available, so you may not need to calculate a stock's beta on your own.
Yet, if you do need to calculate beta, you can follow this step-by-step guide.
Step 1: identify the risk-free rate (Rf)
For investments in U.S. dollars, then the current rate of return of the U.S. Treasury Bills is the risk-free rate. If you are in other locations, you can find comparable investment rates that can be considered the risk-free rate.
The risk-free rate is typically expressed as a percentage.
Step 2: Determine the stock's rate of return and the compared market's rate of return
For example, if you are looking to calculate the beta of an individual stock within the S&P 500 market, then you can observe this individual stock's and the S&P 500's performances over several months and get the average rate of return.
For example, in three months, you've observed that the stock's rate of return is 8%, while the S&P 500 has an average rate of return of 9%.
Step 3: Subtract the risk-free rate (Rf) from the stock's rate of return
Based on the above examples, the stock's rate of return is 8%, and let's assume the risk-free rate is currently 4 %. Simply subtract 4% from 8%, and we get a 4% difference.
Step 4: Subtract the risk-free rate from the market's rate of return
Again, using the above example, the S&P 500 market has an average rate of return of 9% while the risk-free rate is again 4%, the difference would be 5%.
Step 5: Calculate beta
βi=the difference from step 4 divided by the difference from step 5
Using the above example, the beta would be 4% divided by 5%, and we get a beta of 0.8.
Since the beta is lower than 1, this individual stock is more likely to lose money while the S&P 500 market as a whole is gaining and vice versa; the stock may be gaining while the S&P market is losing (although this is a less likely scenario).
Using Beta to Evaluate a Stock's Volatility
While we can use beta to accurately compare an individual stock's performance and a market's (or index's) performance, beta does not offer a complete picture of a stock's risk profile.
Instead, the beta is focused on measuring the individual stock's volatility, and it's important to remember that volatility is not always bad. Remember that the higher the beta, not only the higher the potential risk of investing in a stock but also the potential return.
More conservative investors looking for more stable earning income may not be interested in high-beta stocks due to the higher potential risks. On the other hand, a more aggressive investor with higher risk tolerance might prefer the high-beta stocks instead.
Basic interpretation of beta
Beta can be considered as the risk an investor assumes by owning an individual stock relative to an index or the stock market as a whole.
The risk of an index like the S&P 500 or the whole market is assumed at 1.
A particular stock's beta lower than 1 means this stock is less volatile than the index to which it is currently being compared. Vice versa, a beta above 1 means this individual stock is more volatile than the index to which it's being compared.
For example, if the S&P 500 moves down by 10%, a stock with beta calculated at 0.7 will fall only 7% on average, while another stock with beta of 1.5 will fall by 15% on average.
Risk is directly proportional to return
As the old saying goes: high risk, high return. A stock with a high beta may gain more than the S&P 500 when it gains, while a stock with a low beta won't gain as much.
By understanding this principle, investors can use beta to choose individual stocks that will suit their risk profile: more conservative investors can use stocks with a lower beta, and vice versa.
To diversify your portfolio, it's also recommended to have a good mix of high-beta and low-beta stocks. However, keep in mind that low-beta stocks typically underperform the index and the overall stock market during a bull market, so you may also not experience the highest possible profits during gains.
To summarize, investors can use beta in several use cases:
- To help decide whether to invest in an individual stock
- To evaluate the fairness of the buying or selling price of a stock to determine whether it's the right time to sell or buy
- To evaluate how the addition of an individual stock will affect a market's or index's volatility
- To take advantage of a market opportunity
- To make a stock portfolio more defensive
Why You Should (and Shouldn't) Measure beta
While measuring and using beta can be useful for various purposes, it is not a perfect, one-size-fits-all answer to all your investment programs.
It's also crucial to remember that the relationship between an individual stock and the market is never perfect. Meaning, beta is never 100% accurate and will vary over time for all stocks.
With all these concerns, here are the pros and cons of utilizing beta:
Pros:
- Simple and easy to use: beta is a relatively simple concept to understand and use. The beta numbers for various individual stocks are readily available, and even when not, it's relatively easy to calculate beta.
- An objective way to manage your investment volatility: rather than relying on gut feeling and uncertainty (i.e., trying to read between the lines of a CEO statement,) beta offers an objective mathematical calculation that can help you manage the volatility of your investment portfolio.
- Sizable data to help you manage expectations: Beta calculations use a sizable chunk of data, typically representing at least 36 months (3 years) of measurement. Beta can give you a pretty good indication of whether the individual stock will move more or less than the market (index) as a percentage.
Cons:
- Numbers aren't everything: while numbers don't lie, they also won't tell you about everything that might affect a stock's performance. Beta, for example, can't measure qualitative factors like when a CEO suddenly steps down due to a sickness, which can significantly affect the future of a stock.
- More suited towards the long-term game. To ensure accuracy, it's important to measure beta over a longer period of time, ideally 36 months or longer. Using beta for short-term projections is susceptible to error. This also means you can't use beta to evaluate younger companies or companies that are currently planning for IPO.
- Doesn't paint the complete picture: Beta is, by nature, only focusing on a single thing that doesn't incorporate any other information. So, it won't give you the complete picture, and it will also regularly change as both the individual stock and the index/market move. Since beta changes over time, it should be treated only as a single element of your research and not rely completely on it.
Wrapping Up
Utilizing beta in managing your stock investment portfolio can serve a number of benefits, especially in managing your risks and expectations.
Beta represents a relatively good indication of whether an individual stock will move more or less than an index or the overall market as a percentage, which can, in turn, help you manage your portfolio's volatility and make adjustments accordingly.
A higher beta indicates higher volatility, and while it means higher potential risks relative to the market, it also means higher potential gains. Vice versa, a lower beta means less risk but also lower potential returns.
It's crucial that beta shouldn't be treated as a tool that can 100% predict the future. Beta focuses on measuring the past volatility of a stock, and while we can try to project this volatility into the future, it's not always accurate since a stock's beta can change drastically in a matter of a year or even in months.
What Is a Stock Portfolio and How Do I Start One?
An investment portfolio can include a wide range of investments, including stocks, bonds, real estate, commodities, art, classic cars, rare books, farmland, and so on. Anything one has bought with the idea that it can appreciate in value is an investment.
For our purposes here, we are looking at the construct of a stock portfolio. If you own one stock, you own one stock, but if you own two or more stocks, you have a stock portfolio.
The standard investment advice is to have a diversified portfolio. Why? Because diversification reduces the risk of loss, which is higher when an individual concentrates their stock portfolio holdings on a single industry or sector.
For example, if you have a portfolio that consists of only airline stocks and jet fuel costs increase substantially, every stock in that portfolio is apt to be adversely impacted since fuel costs are the second biggest expense for airlines behind labor costs. However, if you own just one airline stock in your portfolio along with a restaurant stock, a technology stock, a bank stock, a real estate stock, and a casino stock, the risk of loss is reduced since none of those stocks would be directly impacted by rising jet fuel costs.
That is the benefit of diversification with a stock portfolio.
An investor has better protection against outsized losses with a diversified stock portfolio. That would be one that holds many different types of stocks from different sectors. There are 11 S&P 500 sectors: communication services, consumer discretionary, consumer staples, energy, financials, health care, industrials, information technology, materials, real estate, and utilities.
There are 505 stock listing in the S&P 500 (some companies have two different classes of stock), yet there are literally thousands of publicly traded stocks in which to invest. That includes micro-cap stocks (market capitalization between $50 million and $300 million), small-cap stocks (market capitalization between $300 million and $2 billion), mid-cap stocks (market capitalization between $2 billion and $10 billion), large-cap stocks (market capitalization between $10 billion and $200 billion), and mega-cap stocks (market capitalization generally above $200 billion).
Generally, smaller-sized stocks are more volatile than larger-sized stocks, because the pool of trading liquidity isn’t as deep. That doesn’t mean, however, that there aren’t good investment opportunities among smaller-sized companies. In fact, all of today’s larger-sized companies began as smaller-sized companies.
The stocks one chooses to invest in will depend a lot on an individual’s risk tolerance and investment goals. Those are not the same for every investor, but what you know about yourself will play a role in your selection of stocks for a stock portfolio.
You might be conservative on the risk spectrum, so you would likely be looking at stocks with low volatility, dependable earnings growth, and which pay a dividend. If you are on the aggressive side of the risk spectrum, you might be more interested in stocks with high growth potential. They most likely won’t pay a dividend, but they will also be stocks that hold stronger return potential if the companies live up to and/or exceed growth expectations.
To get started with a stock portfolio, then, one must take their own risk assessment and research stocks that fit that risk assessment. Briefing.com can help in that process. Our Emerging Growth Stocks page and our Stock Ideas page, which includes value and income stocks, are updated weekly with investment ideas. Additionally, we write several Story Stocks each day that delve into a wide range of companies across all sectors, and we also have a column, The Next Big Thing, that focuses on initial public offerings (IPOs).
Next, determine how much money you have to invest, and how that money is going to be allocated to each stock in a stock portfolio. For example, if you have $10,000, and want to buy stock in 10 different companies, you could either allocate that money equally ($1,000 for each stock) or invest more in some stocks versus others because you like their prospects more. Perhaps you allocate $3,000 to one stock and $7,000 for the other nine stocks. Again, this decision will boil down to your risk tolerance and your conviction in a particular stock idea.
The simplest way to buy stock is to use an online brokerage service. Once you have opened an account, you will have the ability to buy (and sell) stock on your own or with the help of a registered agent. These services will also help you keep track of how your stock portfolio is doing relative to your initial investment (known as your cost basis) and will provide research tools to help you identify new ideas for what is hopefully a growing, diversified, and profitable stock portfolio.
Annual Trading Roadmap: How to Integrate Stock Market Calendars into Your Plan
Successful investors rely on careful preparation. The best traders understand that markets move in cycles, and scheduled events, including earnings reports, Federal Reserve announcements, IPO lockup expirations, and stock splits, among others, drive these cycles.
Instead of reacting to shifts, active investors anticipate these by using stock market calendars as the backbone of their annual trading roadmap. By aligning your strategy with key economic, corporate, and sectoral events, you can position your portfolio to capitalize on opportunities and mitigate unnecessary risk.
The Role of Stock Market Calendars in Strategic Investing
Stock market calendars consolidate financial market events that have the potential to significantly impact asset prices. This can include jobs data, inflation reports, earnings announcements, and new IPOs. Investors can use this information to:
- Plan trades
- Anticipate volatility
- Time entries and exits
For example, before an earnings season or a Federal Reserve meeting, many investors tighten stops or hedge positions. After a major IPO lockup expires, others scan for potential buying opportunities as insider selling pressures fade. Having access to synchronized calendar tools that provide live market intelligence can help you stay ahead of events rather than reacting after the fact.
Mapping the Year with the US Economic Calenda
The US economic calendar is one of the most critical tools in any trader’s arsenal. It lists the upcoming macroeconomic releases that shape overall market sentiment. This includes:
- Inflation data
- Employment figures
- GDP updates
- Central bank decisions
How to Read the Economic Calendar
Tip: Use Briefing.com’s economic calendar to view the next five weeks of events.
Understanding how to read economic calendar data is crucial, as it provides information like:
- The previous reading (last week, month or quarter)
- The consensus forecast (what economists expect)
- The actual release (the real number, once published, and revisions to prior data)
When the actual data beats expectations, markets tend to rally; when it disappoints, volatility often spikes. By comparing forecasts to actual results, you can gauge whether sentiment is shifting from bullish to bearish and adjust your position accordingly.
For example:
- A strong jobs report may signal economic resilience, which could lift cyclical stocks.
- Weak manufacturing data could reinforce recession fears, boosting defensive sectors.
Use the economic calendar to anticipate these inflection points and rebalance your portfolio seasonally.
IPO Lockup Expiration Calendar: Finding Post-IPO Opportunities
New listings attract enormous attention, but seasoned investors know the real action often comes months later, when insiders’ lockup periods expire. The IPO lockup expiration calendar tracks these critical dates when early investors are allowed to sell their shares publicly for the first time.
Why it matters:
- Expirations often trigger short-term volatility, as insiders or early funds take profits.
- If the stock absorbs that selling pressure well, it’s often a bullish signal.
- Some savvy investors wait for these moments to buy quality companies at post-lockup discounts.
By marking these expiration points on your yearly roadmap, you can identify potential entry points into promising growth names or hedge positions in advance.
Tracking the Stock Split Calendar for Volatility Signals
Reverse splits often go unnoticed, but they can tell you a lot about a company’s financial trajectory. The reverse stock split calendar lists every upcoming corporate action that changes share count and price ratio.
Why it matters:
- Companies may conduct reverse splits to raise their share price above exchange minimums (like Nasdaq’s $1 rule).
- Frequent reverse splits can indicate distress or, occasionally, a strategic reset.
- For traders, they signal potential volatility, liquidity changes, or speculative rebounds.
By reviewing the calendar quarterly, you can identify where institutional confidence might be waning or where small-cap momentum plays are resurfacing.
Using Market Calendars to Manage Risk
You can’t avoid volatility, but you can anticipate when it will happen. By integrating the economic calendar with other event schedules, you can:
- Tighten stop losses before high-impact announcements
- Reduce position size before Federal Reserve meetings or major earnings reports
- Add exposure when “quiet periods†follow volatile events, taking advantage of mean reversion
This calendar-based risk discipline is one reason professional traders consistently outperform reactive investors.
Why a Calendar-Based Strategy Outperforms Guesswork
Markets reward foresight. Traders who integrate multiple calendars develop rhythm and consistency:
- They know when to expect volatility, rather than being surprised by it.
- They align positions with predictable macroeconomic cycles.
- They filter noise, focusing only on events that statistically move markets.
By contrast, investors who ignore calendars often chase headlines rather than preparing for them. With Briefing.com’s interconnected suite of tools, you can anticipate the rhythm of the market.
Your Next Step: Building Your Calendar
A disciplined investor doesn’t just watch the market – they plan for it. Integrating stock market calendars into your trading roadmap can turn raw data into strategic foresight.
With Briefing.com, you can track macro events with the US economic calendar, interpret signals with the economic calendar, and time your entries using the IPO lockup expiration and stock split calendars.
Trade with clarity by claiming your 14-day free trial to access Briefing.com’s full suite of market-moving insights.
Dogs of the Dow
The Dogs of the Dow are the ten Dow Jones Industrial Average components with the highest dividend yield. Sometimes those high dividend yields are the result of falling stock prices while other times they are simply a case of a stock having a high dividend yield.
It is a pretty simple process for investing in a Dogs of the Dow portfolio. After the market closes on the last day of the year, identify the ten highest-yielding Dow stocks, and then buy them at the start of the year investing an equal dollar amount in each of the stocks. Hold the stocks for a year and repeat the process at the end of the next year.
A variation of the strategy is to buy the five lowest-priced of the ten highest-yielding Dow stocks. These are called the "Small Dogs of the Dow." Again, one would purchase them at the start of the year, investing an equal dollar amount, and hold them for a year.
The Dogs strategy has two advantages. First, these stocks provide an excellent dividend yield. Second, the stocks of these high-quality companies are often depressed for reasons that prove temporary, and there are usually one or two of the stocks that significantly outperform.
The Dogs strategy tends to work best when stock market gains are limited or when the market dips.
They are called the Dogs for a reason - these are stocks that have been depressed in value, often because the businesses are beset by some temporary problems. When the stock market is rallying strongly, the Dogs approach often underperforms because growth stocks rise more sharply than these less-volatile stocks.
The website dogsofthedow.com offers an insightful look at the historical performance of the Dow Dogs and the process for carrying out this investment strategy.
Past performance is no guarantee of future results, yet the strategy has a decent track record. Since 2000, the Dogs of the Dow has had an average annual return of 9.5% and the Small Dogs of the Dow has had an average annual return of 10%, according to dogsofthedow.com.
Below are the 10 Dow stocks that qualify for a 2022 Dogs of the Dow portfolio with price/yield indications (the "small dogs" are in red):
- Dow, Inc. (DOW 56.71/4.91%)
- IBM (IBM 133.63/4.90%)
- Verizon (VZ 51.97/4.89%)
- Chevron (CVX 117.36/4.54%)
- Walgreens Boots Alliance (WBA 52.16/3.67%)
- Merck (MRK 76.63/3.58%)
- Amgen (AMGN 224.97/3.41%)
- 3M (MMM 177.59/3.33%)
- Coca-Cola (KO 59.22/2.86%)
- Intel (INTC 51.50/2.68%)
How to Use Margin
Margin is borrowing money from your brokerage house for the purpose of purchasing additional stock. How much money you can borrow depends upon how much marginable equity you have in the account. Once you purchase stock using your margin, the amount you owe is fixed and accrues interest. As long as the accumulated debt plus interest remains under the margin requirements, you do not have to "pay off" the loan. Of course, interest continues to accrue until the margin debt is paid back, usually by selling the stock that was purchased.
Margin Requirements
The Federal Reserve sets minimum margin rules that must be followed by all brokers. Currently these rules are:
- 50% Margin on new positions
- 25% Margin on "maintenance" positions
For example, for a new position, if you purchase $10,000 of marginable stock, you can purchase an additional $10,000 of marginable stock.
For instance, if you purchase 1,000 shares of a $10 stock, using $10,000 cash in your account, an additional 1,000 shares can also be purchased on margin. Your margin debt is now $10,000, on which interest begins to accrue immediately.
This is a 50% margin because you owe $10,000 with $20,000 worth of stock in the account. If the price of the stock falls to $6.75, however, you'll now owe $10,000 on stock that is only worth $13,500. Your remaining equity in the position would be $3,500 ($10,000-$6,500). This is a ratio of 26% equity, which is slightly more than the margin maintenance limit. If the stock price falls below this level, your broker may ask you to reduce your margin debt and/or may liquidate the position.
Marginable Stock
Not all stock is marginable. Some stocks cannot be used as collateral for borrowing margin debt.
Brokerages are permitted to set any additional rules which could be more restrictive than the Federal Reserve requirements. Most brokerages have done this for many stocks, particularly those that experience high price volatility. These rules may vary by brokerage.
Marginable Stocks Can Be Shorted
When you hold stock in a margin account, the brokerage agreement gives the brokerage house the ability to lend your stocks to other account holders who want to sell your stock short. Stock held in a cash account generally cannot be lent to short sellers. If you don't want short sellers to be able to borrow your stock, hold it in a cash account. Of course, this also means you won't be able to borrow against it.
Calculating Your Margin Capability
Before purchasing stocks on margin, it's always wise to check what your margin capability is. This is especially true when you mix marginable stock and nonmarginable stock along with margin debt.
In general, the following principles apply:
- Only your marginable stocks count towards your margin capability.
- Nonmarginable stocks can be bought using margin, but the margin capability is drawn against marginable stocks, and the new nonmarginable stock comes without any additional margin capability.
For example, if you have $10,000 worth of marginable stock in your account (which is still the one opened $10,000 in cash), you can purchase one of the following:
- $10,000 worth of additional marginable stock, or
- $5,000 worth of nonmarginable stock
When you purchase nonmarginable stock using the margin capability of the marginable stock, any change in price of your nonmarginable stock will have no effect on your margin capability. If the nonmarginable stock doubles in price, but the marginable stock declines, you may still face a margin maintenance call.
Briefing.com Thoughts
Margin should be used with great caution. Many people blame the collapse of the stock market in 1929 on the low margin requirements of only 10%. While the 50% and 25% margin requirements help keep the market orderly, they do nothing at all for limiting your personal loss. If you use your entire 50% margin to establish a new position, and the stock falls, you still owe the money. If you are unable to add money, you risk having to sell your stock to close the margin position. Margin increases your personal risk, and you should fully understand the nature of that risk before purchasing stock using your margin capability.
How to Use Market Declines to Locate the Next Great Growth Story
Down or flat markets can be frustrating for most investors. The longer these corrective or churning phases grind on, the more natural it is to step away or "tune out" until the market becomes more constructive.
Yet if history is any guide, these difficult periods represent extraordinary opportunity for growth investors who know what to look for. In short, the price action you see in individual stocks during a correction provides specific clues that allow you to identify who the new leaders will be once the downturn has run its course. The type of price action I'm referring to is Relative Strength.
Let's take a step back for a moment and discuss what precedes an intermediate-term market top. Typically, a few weeks (or even months) before the broad market runs out of gas, the leading high-Relative Strength growth stocks undergo a "purging" phase. Basically, after a big run, investors collectively take a fresh look at which stocks have the best prospects going forward, and which ones have already seen their best days. The sell-off in the latter group is often swift and severe, making this a particularly painful and oftentimes confusing phase for longs (again, this often occurs well before any broad market weakness manifests itself).
Once the broad market correction gets underway, if you know what to look for it becomes increasingly apparent which stocks fall into the former group -- those names that investors believe have the best prospects. In short, a stock that holds up particularly well during a broad market downturn tells you very clearly that institutions are refusing to sell this name and are likely adding to positions on minor weakness -- even while they're lightening up on their other holdings.
In short, the small number of growth stocks that show unusual Relative Strength during a broad market correction are providing clear evidence that these are the names that the "smart money" believes have the greatest upside once the current correction runs its course and are positioning themselves accordingly.
Investors don't need any special software or data to screen for these new leaders -- they appear every Monday in Briefing.com’s Emerging Growth Stocks rankings. (Emerging Growth is just one of many features of the Briefing Investor subscription service). The key is to know what to look for and when to act.
The principle here is actually very simple: during a broad market correction, build and maintain a watchlist of quality growth stocks that show outstanding Relative Strength. The price action can either be sideways, modestly down, or grinding higher, and preferably holding near the 52-week highs. The more orderly the price action, the better, since it suggests disciplined institutional accumulation. (In other words, avoid stocks that appear extremely volatile, or "whippy").
Finally, time is a crucial element: the longer this type of price action occurs, the more bullish the pattern and the more powerful the breakout should be when the market finally turns.
Conclusion
Stocks that show unusual Relative Strength during a market downturn tell you very clearly that these are the names that institutions refuse to sell and are accumulating on even minor pullbacks. Since most funds predominantly use fundamental analysis to pick stocks, you can extrapolate that these institutions must have solid fundamental reasons for accumulating these stocks near their highs while the broad market is grinding lower.
Once it becomes apparent that we're in the midst of a broad market correction, watch the components of the Emerging Growth Stocks rankings to see which ones exhibit the following characteristics:
- Orderly price action that holds just below the 52-week highs
- Shake-out attempts that bounce right back (these are brief but powerful clues)
- Leaders showing signs of "lining up at the starting line."
Once you see price action that suggests item #3, that's the time to go long or place your buy stops just above the range.
Investing in a Rising Interest Rate Environment
Investing is easy. Anyone can do it. All you need is capital and an idea. The hard part is investing in an idea that generates a positive, inflation-adjusted return on that capital in the time you need it to generate a positive return.
Fortunately, the stock market has been a great wealth generating machine for investors with a longer-term time horizon. The historic annualized average return for the S&P 500 is roughly 10% since 1957, but closer to 7% after adjusting for inflation.
That's pretty good either way and it is the basis for pundits preaching the virtue of buy-and-hold investing.
In 2021, it seemed easy to generate great returns buying individual stocks -- or an index fund for that matter. The times, though, they are a changing. They're changing because interest rates are changing. They are no longer as low as they once were, and they are expected to move higher as the Federal Reserve tries to tackle the persistent inflation pressures with a higher policy rate.
That doesn't mean you can't generate a positive, inflation adjusted return on your capital. It just means you must be more discriminating in a rising interest rate environment about the stocks, industries, and sectors in which you invest.
Change Is Coming
Rising interest rates don't necessarily have to be thought of exclusively as a bad thing. Interest rates typically rise for good economic reasons. A stronger economy leads to stronger earnings growth, and the stock market is driven by earnings trends.
Still, rising interest rates inevitably force changes in financing conditions that eventually lead to slower economic activity and slower earnings growth. They also impact stock valuation models, as higher interest rates lower the present value of future cash flows.
The latter understanding has been a driving force for the multiple compression seen in the early part of 2022. Many stocks have seen their earnings multiples (and sales multiples for profitless companies) compress because investors are not willing to pay as much for every dollar of earnings in a rising interest rate environment as they were when interest rates were declining and sticking at lower levels.
They just don't expect companies to be as profitable, or to keep generating the same type of sales growth, that would warrant premium valuations.
Even so, at 19.7x forward 12-month earnings, the S&P 500 is still trading at a 6% premium to its 5-yr historical average and an 18% premium to its 10-yr historical average, according to FactSet. That's before the Federal Reserve has raised rates even once from the zero bound and before the 10-yr note yield has touched 2.0%.

The stock market, though, is forward looking and recognizes that higher rates are on the way, so it is starting to discount that reality now.
The stock market's behavior has been extra volatile to start the year and losses in many individual stocks have been outsized, not only because of the upward path in interest rates but because of the rapid change in interest rates.
When the year began, the 2-yr note yield, which is more sensitive to changes in the fed funds rate, stood at 0.72%. It is at 1.31% today. The 10-yr note yield, which ended 2021 at 1.51%, is at 1.93%. The fed funds futures market is pricing in the probability of at least five rate hikes by the Fed in 2022, whereas it was considering three rate hikes this year a close call at the end of 2021.

The change has been a function of the ongoing inflation pressures and signaling from the Fed itself. It has also been a function of signaling from other central banks, which are also aiming to tamp down inflation pressures of their own. To be sure, the inflation seen in the U.S. is not just a U.S. problem.
A Counter Argument
We know, then, in the context of this rising interest rate environment that inflation is a problem. From an investment standpoint, that creates investment opportunity in companies that can provide an inflation hedge.
That would include commodity-related stocks that can be found in the energy and basic materials sectors.
It also includes companies that can retain pricing power and where demand for a product or service is inelastic, meaning a change in price isn't going to change the demand for a product or service by a large amount.
That would include health care and consumer staples companies. Those companies are known as counter-cyclical companies. That is, they tend to do well even when the economy is suffering since the demand for their products or services is fairly constant.
The utilities sector is another counter-cyclical sector, although rising interest rates can still spell problems for these stocks since many utilities companies carry high levels of debt given the investment-intensive nature of their business and pay attractive dividends that might be seen as less attractive versus the income that can be provided by a risk-free Treasury.
In general, though, a rising interest rate environment that triggers an economic slowdown often produces better relative returns for counter-cyclical sectors.
The financial sector is another area that tends to do well when rates start to rise. Banks generally find some investment favor on an assumption that a steepening yield curve, which is typically associated with a strong economy, will drive increased profitability on the back of increased loan demand, higher investment income, and an expansion of net interest margins. Insurers also tend to benefit as they are able to generate more investment income when Treasury yields are higher.
Finding Value in Value
When interest rates go up, you generally want to avoid stocks trading with high valuations relative to the market and their peer group. They will get hit the hardest in the event of an earnings disappointment or, in the case of companies not making money, a slowdown in sales growth.
Stocks accorded premium valuations are growth stocks. Many also carry a moniker of being long-duration issues, meaning a significant amount of their cash flows won't be seen until the distant future. Consequently, rising interest rates lower the present value of those distant cash flows.
In the same vein, longer-duration bonds are also prone to underperformance since they are more sensitive to changes in interest rates.
Stocks that tend to do better when interest rates start to rise are value stocks. Value is a relative term and there are different analytical approaches for determining what is a value stock. A standard definition is a stock trading below its intrinsic value. Generally, stocks trading at a discount to the market multiple are considered to be value stocks.
Presumably, they carry more upside potential in an improving economy that is accompanied by rising interest rates since they have improved earnings surprise potential that is not reflected in their discounted valuation. Many value stocks are value stocks because of a prior growth disappointment. Some also get left behind because the value factor is out of favor in a market that had previously favored growth stocks.
There is relative value, then, versus the market and relative value versus industry peers. If one is looking to buy a value stock, it is important to distinguish why the stock is trading at a discount to its peer group. That would help avoid falling into a "value trap," as opposed to investing in a value stock that truly outperforms in a rising interest rate environment.
The relative valuation analysis can be looked at through different ratios, such as price-to-book ratios, P/E ratios, and price-to-earnings growth ratios.
Another generally successful approach in a changing interest rate environment that features rising interest rates is to avoid speculative story stocks and to embrace stocks of established companies that are profitable, free cash flow positive, pay a dividend, and have good balance sheets. That would be blue-chip companies.
In brief, one should be looking to buy quality companies at a reasonable price as opposed to buying unprofitable companies at any price. The latter can work for a time when interest rates are at rock-bottom levels and aren't thought to be going up soon, but when that perspective changes, the pool of marginal buyers typically gets much shallower and subsequent declines in the event of a disappointment get much deeper.
What It All Means
When interest rates change, investment approaches will also change. Investing in a rising interest rate environment requires more humility and a lot less bravado because inflation-beating returns will be harder to come by. In turn, market volatility will be higher.
Value stocks tend to do better than growth stocks as interest rates start to rise. Eventually, interest rates reach a tipping point for the economy, and when it becomes apparent that higher rates are leading to much lower levels of growth, then growth stocks will start to exhibit some relative strength again.
Of course, one can always stick with the simple approach of owning an S&P 500 index fund. That can be painful to endure at times, but if time is on your side and you have the latitude to hold through the more challenging times, the historical track record speaks for itself as a good investment idea that will provide you a positive, inflation adjusted return on your capital.
What Is a Limit Order in Stock Trading and How Does It Work?

The stock market is a favorite among many investors because if you bet on the right stock, you can make a considerable amount of money. However, the downside of getting into a stock trade is that it’s hard to get the right closing price.
Stock prices constantly fluctuate in value, and that was best seen in November 2020, when the total market capitalization reached a record $95 trillion. Therefore, it can be hard for investors to keep up and make smart choices.
If you want to make smart investments, you need to educate yourself. And one of the first things you need to know is the concept of the limit order in stock trading.
What is a limit order in stocks?
In the world of stock trading, a limit order is a type of order that allows investors to sell and buy securities at a pre-set price in the future. When this set date comes, the investor can execute the trade if the stock price reaches this pre-defined level.
In simple terms, a limit order in stocks sets the maximum or minimum price limit an investor is prepared to buy or sell the stock for. If you as an investor use a limit order when buying stock, you are guaranteed to pay that price or one that’s smaller.
Let’s say that you want to buy a stock at $15 and you enter a limit order. If you do this, you wouldn’t pay any more money than the maximum price you would pay for that stock, which is $15, but you could still get the stock for less.
However, it’s important to note that even though the price limit you set is guaranteed, you can’t be certain that the order will be filled. And if you find yourself trading in a fast-moving market, you might miss your trading opportunity if you don’t move fast.
Four types of limit orders
Now that we’ve answered the question of what is a limit order in stocks, we need to take a look at the different types of limit orders:
- Buy limit. An order for purchasing a security at a specified price or below it. If you want to set a buy limit order, you need to place your order either below or at the current market bid price.
- Sell limit. An order for selling a security at a specific price or above it. If you want to make sure you get a good price, place your order either above or at the current market ask.
- Buy stop. An order for buying a security at a price that is higher than the current market bid. This type of limit order is only activated if and when the so-called “stop level†has been reached. When that happens, the order is converted into a limit or market order.
- Sell stop. An order for selling a security at a price that is lower than the current market price. Just like with the buy stop limit order, a sell stop is activated only when it reaches a specified price level.
How does a limit order work?

As we previously explained, a limit order is the pre-set price a buyer or a seller places on a security to determine its maximum or minimum price, based on whether they’re buying or selling it.
Let’s say a trader wants to buy stock from company X but doesn’t want to pay any more than the maximum price of $10 per share.
By putting a limit order on this stock, they will end up purchasing it at the price of $10 or lower. If a seller is interested in putting a limit order on the stock of company X of $10, they won’t sell any shares of stock for a price under $10.
There are multiple reasons why someone might want to use a limit order. One of the most common ones is when the price of a stock is falling or rising too quickly and the stock trader is worried they are going to get a bad fill from a market order.
Another instance in which a limit order is used by traders is when they aren’t watching a stock but have a price in mind for which they would like to buy or sell a security.
When should you use a limit order?
Traders use limit orders when they don’t want to miss a good opportunity or want to take control over their portfolio in a way they couldn’t under different circumstances. Simply put, they’re a great option for those who aren’t ready to trade stocks at that moment.
Let’s take a look at the different instances of when you should use a limit order:
- When you don’t want to keep an eye on the market. Trading can bring about a lot of different emotions and you can avoid that if you place a limit order. It will encourage you to engage in other activities without keeping an eye on the market and waiting for the perfect opportunity to trade.
- When you want to trade multiple shares. If you’re trading a large number of shares, a limit order can allow you to avoid slippage. If you place a market order, it’s hard to predict slippage. But when you’re dealing with limit orders, you already know the maximum amount of money you’ll pay for your shares of stock.
- When you’re hoping for a good price. If you have a specific price you want to pay for a stock or get while selling it, you can lock that price in with a limit order. But if you don’t get the price you’re hoping for, the order simply won’t be processed and there won’t be any harm.
- When you’re interested in trading low-volume stock. If you want to trade stock that doesn’t usually trade frequently, like for example shares of a small business, a limit order would be a good idea. This is because you can get the price you want without waiting a long period of time for the order to go through.
Limit order pros and cons

Just like with all investment tactics, it’s important to be aware of all the different pros and cons of limit orders before you get into them.
One of the biggest advantages is that you can set a price ceiling or a price floor, depending on whether you’re buying or selling stock. This is especially useful when operating in a fast-moving or volatile market.
Another great benefit is that limit orders can give you the opportunity to participate in extended-hours trading sessions including both pre-market and after-hours sessions. If you set your order during a standard exchange trading session, you can choose to carry it over to a future standard trading session.
As for the downsides, something that puts off some traders is the risk of no execution. If the security doesn’t reach the limit price you’ve set, you won’t get the deal you were hoping for. Especially since market orders are always executed before limit orders.
And finally, there is always a risk of partial fills when not all of the shares are executed in order, leaving some of them unfilled. But if you apply special conditions to limit orders, you can lower the investment risks of partial executions.
Limit order vs. market order vs. stop order vs. stop-limit order
These are all important terminologies, but they can be a bit confusing for beginners. Let’s go through each of them so you can get a full grasp of what they mean.
Limit order
As we already answered the question of what is a limit order in stocks, here's a quick reminder. A limit order is a special type of order that investors make when they’re hoping to sell or buy a security such as a stock at a pre-set price in the future.
Market order
The two main execution options when it comes to price are limit orders and market orders. A market order is a transaction that is meant to be executed as soon as possible at the current price. This transaction is done at the best price that is currently available.
When it comes to market orders, they are executed immediately unlike limit orders. You can’t guarantee the price of the transaction and it can either be lower or higher than the current market price when the order goes through.
However, while you can’t guarantee that a limit order will be executed, you can be sure that a market order will be.
Stop order
Stop orders are very similar to market orders as they’re both placed when an investor wants to reach a certain price for a stock. But the difference is that a stop order, which is also known as a stop-loss order, is triggered at the stop price.
As for a buy stop order, it is stopped when it reaches the given price or higher, and a buy stop order does the same when it reaches the given price or lower. So while a limit order by design is meant to capture gains, a stop order is meant to minimize losses.
Stop-limit order
One aspect of limit orders is that they’re visible to the entire market as soon as you place them. That way, other traders know that you’re interested in making the trade and what price you’re looking to get. A stop order, on the other hand, doesn’t become available until the trigger price you set is met.
It sets a stop order that ensures the order isn’t activated until the stop price is reached. And once it does, you can set a limit order to make sure your trade doesn’t exceed your given limit price and combine it into a stop-limit order.
Summary
Investing in the stock market comes with a lot of moving and confusing parts, which beginner investors usually find overwhelming. When you’re putting an investment strategy together for the first time, it’s vital that you understand all of the different order parts that exist and how they come into play.
Limit orders are a great beginner order because they give you more control over how much money you’re willing to invest or hoping to gain. If you’re just starting out and are feeling overwhelmed or insecure, limit orders will help put your mind at ease.
How to Buy Puts as a Hedge
With a volatile market, a fear on everyone's mind is committing new money to the market.
The worry is that what you invest today may lose 5% or 10% if the market declines.
How can you avoid this, but still commit money to the stock market?
One possible approach to limiting downside risk is to buy a put option at the same time you purchase your stock. The put is bought at the same strike price as your purchase, leaving only the premium of the put as your expense. The put gives you the right, but not the obligation, to sell your shares back to the writer of the put at the strike price.
If the feared decline occurs, you have two choices: exercise the put, or sell the put. If you exercise the put, you sell your stock, and your entire investment is returned to you. The cost of the put is your true loss and you're out of the market. If you sell the put, you can recover all of your loss on the stock investment, plus whatever premium is still in the put, but you remain exposed to risk since you are still holding the stock.
Here's how it works.
For the stock purchase, first determine if options are available. Next figure out the price of the put option closest in strike price to the current price of the stock. Often there will be several time durations available.
Pick the time period with which you are comfortable. Just like insurance, the longer you want the protection, the more it costs.
Before employing this strategy, you should calculate the following items:
- The total cost of your investments: This is the stock and the price of the put. We have left out commissions in the calculations below but include them if you can.
- How high the stock must rise to cover the cost of the put. Take the total price for the put, add it to the total price for the stock, and divide by the number of shares of stock. This is your breakeven point. If the stock rises to this point, you have paid for the price of the put. Of course, if the stock rises to this level before the put expires, there may be value still left in the put.
- Your target price and time period for the stock. Obviously, this price must be higher than your breakeven point for the strategy to be profitable.
- Calculate the return during this time period with and without the put. Make a subjective judgment as to whether the tradeoff in return is worth the reduction in risk.
| Item | Symbol | Price |
|---|---|---|
| IBM Common | IBM | 120.69 |
| September Put at $120 | IBMUD | 4.00 |
| October Put at $120 | IBMVD | 6.25 |
*Note: Prices are not actual but for illustration purposes only
- Calculate the total cost: 100 Shares IBM @ 120.69 = $12,069.00
Plus: 1 Contract September 120 Put @ 4.00 = $400 or:
Plus 1 Contract October 120 Put @ 6.25 = $625
Total Cost is $12,469.00 for the September protection, and $12,694.00 for the October protection. - Calculate the breakeven point: IBM stock must rise to $124.69 to break even. For the October protection, IBM must rise to $126.94.
- Know your target price: For the purposes of example only, let's use a target of $130 by September 18 and $140 by November 16.
- Calculate the return: For the September put strategy, your potential profit is $531.00, or 4.4% with downside risk of $400, or 3.3%. Without the put, your potential profit is $931.00 or 7.7% with no downside protection. Limiting your downside risk to 3.3% costs you 3.4% return in this example.
For the October option, your potential profit is $1,306.00, or 10.3% return. The downside risk is $625, or 4.9%. Without the put, your potential profit is $1,931.00, or 16%. Limiting your downside risk to 4.9% costs you 6.3% of reward.
In both examples, we assumed the option expired and was worthless. In reality, it is likely that you could close the option position for a small amount of return prior to expiration.
Additionally, the example above is what it costs to completely eliminate downside risk. It can be considerably cheaper to simply reduce downside risk. The same calculation methods can be used for partial coverage or for accepting a certain amount of downside risk.
Are these tradeoffs worth it? That's completely up to you. If you feel that the real risk is a catastrophic collapse, and not a gradual decline, but you believe the market will climb if the catastrophic collapse is avoided, you may wish to consider put options as hedges.
Please note that Briefing.com provides these comments as explanatory material for our readers. This does not guarantee that you will make money. If stocks decline, you will still lose the cost of the put. If the put expires without selling or exercising it, you lose the total premium paid for the stock. Expiration of the put means that any protection you have is also gone. If you do not have experience trading puts, we highly recommend that you practice with paper trades before placing a real trade with real money.
How to Sell Covered Calls
In a down or flat market, it can be tough to invest or trade. One way to raise cash in a slow market, without selling positions, is to sell covered calls. If you are right about the overall market trend and the trend of your particular stocks, you can generate a modest return while waiting for overall conditions to recover.
Selling Covered Calls in a Slow or Down Market
Selling covered calls is another way to take advantage of a slow or down market.
The tactic is particularly useful when you already have a position in a stock you intend to hold for some time (at least longer than you expect the market downtrend to be). Selling covered calls can take the sting out of the paper losses you must endure while continuing to hold the stock.
The upside of a covered call tactic is immediate cash in your account. The downside is that it ties up your position (until you close the call position) and a possible assignment of your option, which means you must deliver the stock.
However, if you feel that the market is headed down for a while, and you are right, selling covered calls can put cash into your account immediately (subject to clearing) without ever having to deliver the stock to the person who buys the call option.
Meanwhile, you can continue to hold your stock position until the market recovers.
Covered Calls - Definitions
A call is an option that gives the holder the right to buy 100 shares of stock from the selling of the call-option-contract at a specified "strike" price.
The "strike price" is the amount that the holder of a call option will pay if he decides to exercise the option. If the strike price is $50 and the option is exercised, then the holder will pay $5,000 ($50 times 100 shares) to the seller of the option.
The "option price" is the amount that a single option contract costs. Option prices are always quoted in per-share prices, but a single option contract always covers 100 shares. The total cost of purchasing an option is always the "option price" times 100 shares.
An "in-the-money" option is one whose strike price is lower than the currently trading price of the option. The total "option price," however, is usually high enough to prevent the option from being exercised for an immediate profit. When the stock price rises high enough so that the total strike price paid plus the total option price is lower than the total market value of the shares, there is an incentive to exercise the option. Often, option holders will simply sell the option for a profit rather than exercise it. Many times, the purchaser of the option in this case is someone who originally sold the option, with the intent to prevent his actual shares from being called.
A "covered call" is a term describing a call that is sold by a person who already owns enough shares of the stock in question to deliver those shares, if the option is assigned.
"Assigned" means that the person holding a call option makes the decision to exercise it, pay the strike price for the shares and have the stock delivered to him. The "assignment" occurs when the exchange tells the seller that someone has exercised the option and the shares must be delivered. Generally, no action needs to be taken by the option seller; the sales proceeds appear, and the stock is removed from your account.
Please note that you should probably not try this tactic as your first experience with options, however. Start with simply purchasing options. As a purchaser, your potential loss is always limited to the amount you spend for the option itself.
Choices
When you decide to sell a covered call option, there are several choices you need to make:
- Expiration date
- Strike price
- Number of shares
For expiration dates, there are usually several choices of varying length. The longer the expiration date, the higher the premium for the option will be, but the more risk you take that the stock might be called.
There are also usually numerous choices for a strike price. In general, the number of outstanding options at any time is higher for options that are "in-the-money." Choosing an option contract with a higher number of outstanding contracts means greater liquidity. Higher volume can provide better pricing, but also "fresher" bid/ask data (which can sometimes be a problem).
For a "covered call" tactic, the number of contracts you can sell is limited by the total number of shares you already own. You must have at least 100 shares to write a covered call contract. You can sell any number of contracts for which you own 100 shares. For example, if you own 850 shares of a stock, you can sell up to 8 covered call contracts.
After you have made these choices, you are ready to sell the covered call. All you need to know is the ticker symbol for the call option.
Most brokerages provide an "options chain" capability for easy lookup of the ticker symbol. Although there is a standardized convention for option ticker symbols, clicking on the "options chain" link at your online brokerage is a lot easier.
Selling a Covered Call
When you decide to sell a covered call option, you place an order with your broker, just as with any sales order.
The actual steps to place the order vary by brokerage, check with your broker for the exact procedure.
Pricing
As with any sales order, you have the choice of a market or limit order.
Pricing is determined by a bid/ask system, just as with stocks and the same cautions about marker orders exist with options.
The exact price offered for any option is set by the market. The theoretical "correct" pricing involves mathematics that is beyond the scope of this article.
Before placing an order, verify the date of the most recently traded option with the same strike and expiration date. Sometimes, the bid/ask data shown for a particular option can be quite old for a thinly traded contract. If so, do not place a market order to sell the contract.
Receipt of Proceeds
When you sell a covered call, the proceeds from the sale appear in your account as cash. The amount earns interest or offsets your total margin balance, just as a sale or other check deposit would (and unlike short sale proceeds).
However, while the option contract is open, a restriction is placed on your shares. In general, the underlying shares for the stock behind a covered call cannot be sold unless the open call contract is first closed. If the shares were sold prior to the option position being closed, the call would become a "naked" call. Generally, a brokerage firm will not allow an open option contract to convert from covered to naked status while the position is still open.
In addition, the value of the shares behind your open covered call position will not be used to determine your overall margin capability (generally). Selling a covered call lowers your margin capability (in most cases).
The Upside
Selling covered calls provides you with the following benefits in a down market:
- Cash proceeds, which can offset the paper losses during a down market
- The ability to "set your price" for selling the underlying stock
- The holding period for the underlying stock is unaltered by selling the calls. (Important if you are close to the long-term capital gains period)
If all goes well with the "selling covered call" strategy, the option expires without you having to ever do anything. At that point, if you still think the market is headed down, you can sell new covered calls against the very same shares of stock.
The "set your price" concept involves picking a strike price at which you would be happy to sell the stock. For example, if you originally envisioned selling the stock at $50 a share, but the current price is just $42 a share, it may be beneficial to sell a covered call with a strike price of $50. This is what you would have sold for anyway, but by selling the covered call, you increase the total proceeds from your sale.
The Risks
The risks associated with selling covered calls are largely related to the stock price rising unexpectedly and include:
- Having to close your call option position by buying the option at a higher price than you sold it for
- Having to deliver your shares because of the call option being assigned to you
- Limiting your ability to sell the underlying shares while the option is still open
The last risk is probably minimal, as the covered call tactic is primarily designed for situations where you want to continue holding a stock during a down market period.
Before embarking on any covered call sales tactic, you should determine if you would be comfortable selling the stock if the strike price was reached. If not, rethink your approach.
How to Sell Stocks Without Paying Taxes

The stock market has been one of the most popular ways for investors to earn extra money. If you play your cards right and follow the state of the US stock market index, there is a chance you will get great returns on your investment.
Everyone has heard of the stock market and knows that if you learn how to make money in stocks, you’re in for a bright future. However, where there’s money, taxes follow soon after. If you’re wondering if there’s a way to sell shares of stock without paying taxes on stocks, you’ll be happy to know that the answer is yes.
Capital gains tax

Before getting into the details of how to sell stocks and not pay taxes, we first have to talk about taxes in general. The first type of tax you should know if you’re looking to sell stocks is the tax on capital gains.
When you make a profit from selling shares of stock, you receive something that is known as capital gain, and you need to pay capital gains taxes on this profit. You won’t have to pay taxes on capital gains until you sell the stock you own.
Tax on capital gains can be divided into two categories:
- Taxes on short-term capital gains. If you hold on to an asset (in this case, stocks) for a maximum of one year, you’ll pay short-term capital gains taxes on the profit you earn from selling the stock. The short-term capital gains rate is the same as your regular income tax rate.
- Taxes on long-term capital gains. If you hold on to your stocks for longer than one year, you will pay long-term capital gains taxes on your stock profits. The rates for the long-term capital gains tax rate depend on your filing status and taxable income. They can be 20%, 15%, or 0%.
Dividends tax

When companies pay out the income they earn to a shareholder of stock, this income is known as a dividend. Dividends are usually paid either monthly or quarterly and they can be paid in both cash and shares. They are taxable based on the type of dividend you’re receiving and your income level.
There are two types of dividends:
- Qualified. These dividends come from the investment income you’ve made in the U.S. or qualifying foreign companies. For a qualified dividend, you need to hold on to your dividends for at least 61 days or a holding period that lasts for 121 days. For this income, you will be taxed at the long-term capital gains rate.
- Non-qualified. Also known as ordinary dividends, non-qualified dividends include most dividends that are paid to the shareholders. They are taxed at the short-term capital gains rate.
Dividends can sometimes be hard to figure out, especially for people who aren’t sure about whether the ones they’re holding are qualified or non-qualified. This can get frustrating when it’s time to pay taxes on dividends.
Luckily, the IRS can help with that. If you earn $10 or more from your dividends or different investments, you will receive Form 1099-DIV which will report your dividends properly. This way, you won’t have to worry about making the distinction.
When do you pay taxes?
If you’re interested in how to sell stocks and not pay taxes, you need to be aware of one thing: when you make any sort of gain, it’s considered to be taxable income. You can’t expect to make a lot of money without paying any taxes.
If you’re new to the world of trading and are wondering how big of a tax bill you will receive next year, you need to educate yourself properly. The first thing you should know is where your capital losses and gains are reported in your brokerage account.
After you get that information, you need to make a rough assessment of how big your total adjusted gross income will be at the end of this year. It’s best to talk to a tax advisor or a financial advisor to ensure you understand this properly.
Let’s circle back to capital gains taxes. Depending on how long you’ve held the stocks and your overall annual income, the tax percentage can be anywhere between 0% and 37%.
If you’re paying long-term capital gains taxes, you can expect to pay less in taxes than you would if paying short-term capital gains taxes. The tax on long-term capital gains is between 0% and 20%.
However, if an investor has a lower income, they might not owe any taxes to the IRS. Single filers making less than $41,675 have a 0% long-term capital gains tax rate. Single filers earning between $41,675 and $459,750 have a 15% long-term capital gains tax rate. The long-term capital gains tax rate jumps to 20% for single filers making over $459,750.
One thing you need to remember is that your AGI will include all of the income you’ve made during the current year, not just your salary. This means that the gains you’ve made will most likely count towards your AGI and could lead to higher ordinary income tax rates.
How to sell stocks without paying taxes: 4 proven tips

For everyone who wants to know how to sell stocks without paying taxes, there are four proven methods, and you can opt for the one that suits you best.
Keep your earnings in the lower tax bracket
If you’re in the lower tax bracket or you’re already retired, you most likely don’t have to worry about capital gains taxes. Staying in the lower tax bracket also gives you additional tax deductions on things such as medical expenses and mortgage interest.
Donate or gift your stock
Are you someone who donates to charity? If you are, consider donating your stock directly. There’s no need to sell your business stock and donate the money because most charities will accept stocks. When you do this, you won’t have to pay any capital tax for the gains on stocks.
As an added bonus, when you donate to charity, you can write it off as a tax deduction and reduce your overall taxable income. This is a very popular strategy because it’s mutually beneficial and you can even make a larger donation without worrying about taxes.
If you want to take a different route, you can gift your stock to a family member who falls under the umbrella of the lower tax income bracket. As long as the tax is worth $15,000 or less when the person you gifted it sells it, they won’t have to worry about the capital gains tax.
However, tax laws regarding gifts often change. Just like it’s important to learn how to research stocks if you’re planning on being an investor, it’s also important to educate yourself on tax laws.
In case you plan to gift your stocks, make sure to know all the rules related to gift taxes. It’s much different to gift stocks to someone than it is to go through the sale of stocks.
Take advantage of tax-loss harvesting
Tax-loss harvesting is a technique during which an investor sells their stocks or any other securities they have. At the time of the sale, these securities are held in a taxable investment, and when they are sold, they are sold at a loss.
This may sound counter-productive, but tax losses can be very useful. One of the things you can do with them is offset the impact of capital gains when selling other stocks you have.
Excess losses, either short-term or long-term, are generally used to offset additional capital gains from other securities sold at a profit. And then, depending on how much your losses for the year exceed your gains, you may use a maximum of $3,000 to offset any other taxable income on your regular income tax returns.
If you have additional losses, you can carry them over to the next tax season and use them for your next year’s annual tax returns.
However, if you want to use this strategy, you need to make sure to avoid wash sales. According to the wash sale rule, you aren’t allowed to purchase sales of identical or substantially identical stocks for a period of time of 30 days before or within 30 days after you’ve sold stocks for a loss.
If you violate the wash rule, you won’t be able to use the tax loss against your capital gains that year.
Move to a state that is more tax-friendly
This may seem like a drastic move, but if you’re willing to relocate so you can avoid capital gains taxes, there are some states that are more tax-friendly than others. Two of those states include Florida and Nevada.
When you sell your stocks and are a resident of one of these states, you won’t have to pay a state capital gains tax. However, there isn’t a guarantee a state that’s currently tax-friendly won’t change its tax rules in the future, but it’s still a solution some people opt for.
Final thoughts
The federal tax code is very complex, but if you want to learn how to sell stocks and avoid taxes, you need to get acquainted with it or work with an advisor who is. The tips discussed here are legal, so it’s not tax evasion or anything similar.
Buying and selling stocks is a great way to create a long-term investment for your future, and if you know how to minimize the taxes you may be required to pay, that’s an even better deal.
Short Selling: How to Short a Stock
Trading on the stock market can be a risky endeavor, but investors are always finding ways to profit off it, even if a stock they’re interested in falls in value. Stock market declines of 5% to 10% generally require a month’s recovery time, but these declines aren’t bad news for all traders.
A lot of investors make money from stocks that go down during declines by implementing a strategy known as short selling, also referred to as shorting a stock. However, this is a risky strategy, and you need to know everything about it before you get into short selling.
What exactly is short selling?
Short selling is a strategy where a trader borrows shares and sells them immediately while also expecting that the price for those stocks will soon fall. When that happens, the trader can buy the shares back at a lower price than the one they were originally valued for.
The next step is to return the shares to the broker from which they originally borrowed the stocks and profit off the difference.
For example, if you borrow 10 shares of a company and sell them for $10 apiece, you will generate $100. And if the price suddenly drops to $5 per share, you can use that same money to buy the shares back, ending up with a profit of $50.
This may sound simple, but there is a lot more to this investment strategy. If you want to learn how to short a stock, you need a lot more than the knowledge of how it works.
This trading strategy requires a lot of speculation as you can never be sure if or when the prices of stocks will fall. Speculation carries the possibility of considerable risk, which is why only experienced traders are usually brave enough to take on short selling.
How short selling works

As we already mentioned, short selling typically requires borrowing stock, which means you will be trading shares that are owned by somebody else.
When the trader wants to close a short position, they wait until the price of the borrowed stock they sold declines. Then, they simply buy them back for a considerably smaller price. And once they make a profit, they return the borrowed stock and repeat the process again and again.
But before you can close a short position, you need to open one first. To do that, you need to have a margin account and pay interest on the shares you borrowed for as long as the position is open. You wouldn’t be able to get into short selling without a margin account.
However, you should realize that as a broker, you need to have a certain amount of money in this account which is known as the maintenance margin. The minimum value is set by the New York Stock Exchange (NYSE), and the Federal Reserve.
Short selling can be a great way to earn a profit on the stock market in a very short time, but it’s never guaranteed as there are a lot of risks.
Take the example we gave above into consideration. If you believe the price of a certain stock is overrated, you purchase 10 shares, and if everything goes according to plan, you would walk away with a profit of $50.
However, if the stock doesn’t decrease in value as you expected, you would still have to buy it back as it’s borrowed stock, and you would be looking at a loss.
Pros and cons of short selling
As you have probably figured out by now, short selling has a few upsides and downsides to it. Since it’s a high-risk strategy, it can cause you to lose your money, but it can also lead to incredible profit – both very possible options.
Let’s look at short selling pros and cons a bit more closely.
The pros of short selling
If you’re able to correctly predict the movement of the price of a certain stock, you will have a great return on your investment, especially if you initiate the trade with margin. When you use margin, the initial investment doesn’t require too much of your capital.
The pros of short selling include:
- Potentially very high profits with little initial capital required.
- Leveraging possible investments.
- Hedging out your portfolio’s long-only exposure while also reducing its overall market exposure.
- Using the capital proceeds you earn from short selling to overweight the long-only components of your portfolio.
- Reducing the overall volatility of your portfolio due to the exposure to both short and long positions.
The cons of short selling
The high risk of short selling we mentioned before includes the following disadvantages you might experience with this type of trading:
- There is no limit to how much stocks could rise, so you might end up with a huge loss.
- It’s almost impossible to predict if the value of a stock will fall or rise.
- Running the risk of the stock you borrowed being recalled by the broker.
- The risk of short squeezes (significant and rapid price moves) will bring out a lot of short sellers, in turn pushing the prices of the stock.
- Trying to borrow less-liquid stocks is usually expensive.
- Volatile market conditions may cause a ban of short selling altogether.
When and why should you sell short?
A big part of learning how to short a stock is learning why you should sell short and when would be the perfect opportunity.
You should sell short if you believe the price of a stock is going to drop soon. Some traders use speculation when selling short, while others do a thorough examination of the financials, management, and future potential of the company whose stocks they’re planning to sell short.
The more important question we need to answer is when to sell short. There are certain situations when short selling makes perfect sense, or in other words, when the conditions are ideal. Going in too early or too late will cause you to make a lot of mistakes and lose out on some great opportunities.
But if you wait for the perfect moment, you can almost guarantee success. Here are a few examples of good conditions for short selling:
- During a bear market. A bear market occurs when securities prices fall 20% or more so people who want to profit off short selling have the best chances of doing so during this time. One of the most famous bear market ever was the US bear market of 2007–2009, which lasted for 17 months.
- When fundamentals are deteriorating. There are a lot of reasons why a stock’s fundamentals might deteriorate, but the reason isn’t important for selling short. Bad fundamentals might lead to weaker data that usually indicates an economic slowdown and leads to a bearish trend.
- When there are elevated levels for valuations. Sometimes, rampant optimism might lead to elevated levels for valuations of certain sectors or the market. A lot of investors will be disappointed when their expectations aren’t met, but short sellers wait for the market sector to roll over and earn a profit.
What else do you need to know before selling short?

Besides the cons of short selling we already mentioned, you need to be aware of the following things related to short selling and all the risks that we still haven’t explored:
- Margin accounts. When you open a margin account, you use your investments as collateral when you borrow money from the brokerage. You’re required to meet the minimum maintenance of 30% on your account; otherwise, you will have to either put in more cash or liquidate your position.
- Timing. You can never be sure how long it will take for stock prices to decline, even if a company is overvalued. And while you wait for the prices to drop, you will be vulnerable to margin calls, interest, and even being called away.
- Regulatory risks. In some cases, regulators can ban short selling in certain sectors or even in the broad market. This is done to avoid causing panic or selling pressures which can lead to a sudden spike in stock prices, which leads short sellers to cover their positions and take huge losses
- Not going with the trends. If we look at the history of the stock market, stocks usually have an upward drift, and most stocks accelerate in price in the long run. That means that short selling goes against the trends and when you trade like this, you’re ignoring the overall direction of the market.
- The short squeeze. When stocks begin to rise and short sellers start to buy their short positions back to cover their trades, it might cause a feedback loop known as the short squeeze. The demand for shares will attract even more buyers, which will, in turn, increase the price of stocks and the cycle will continue.
How to short a stock
Now, let’s go into detail on how to short a stock.
- As we already mentioned, you will need a margin account. The process for obtaining one varies from one brokerage to another, but you will probably need approval before you can open the account.
- You will have to have either stock equity or cash in your margin account that will serve as collateral to make any trade. It needs to be equivalent to at least 150% of the value of the short position as stated by the requirements made by the Federal Reserve.
- If you fulfill these requirements, you can enter a short-sell order in your brokerage account and acquire a short position, meaning you can borrow shares.
- To maintain your short position, the equity in your margin account needs to be at least 30% per exchange rules. It’s also important to note that you will pay interest for the shares for as long as you have them.
- And finally, when the stock price falls, you can close your short position, buy out the borrowed shares, and return them to the broker. Just don’t forget to take the interest, commission, and fees into account when calculating your profits.
The controversy around short selling
Finally, you need to be aware that there is a lot of criticism surrounding short selling. Short sellers have been accused of a lot of negative things, including manipulating public opinion, hurting businesses, and even spreading rumors about the stocks of a certain company or even the company itself.
Short sellers are often viewed as ruthless operators who are out to destroy companies and their profitability. Unfortunately, the controversy around short selling occurs due to the unethical speculators and all the practices they employ such as market manipulation. This is illegal, but still happens.
However, if you understand short selling, you realize that it actually provides liquidity to markets as it fills them up with enough sellers and buyers. They can even stop bad stocks from rising due to over-optimism and unnecessary hype.
They keep this unbridled enthusiasm in check and in some cases even uncover fraud, poorly run companies, and aggressive accounting. Short sellers can bring a lot of new information to light and cause a more sober assessment of some companies’ prospects.
Final thoughts
Learning how to short a stock can be a very profitable venture and the process itself is very simple once you learn the ropes. However, this is in no way a good strategy for traders who don’t have enough experience because it takes a lot of knowledge and practice to come out on top while short selling.
Before you get into this form of trading, you need to weigh the risks and rewards very carefully and be sure that short selling is the right choice for you. So, tread lightly and happy trading!
Timing Trades with Analyst Upgrades & Downgrades
Momentum follows perception. When perception changes, prices move. And few events shift perception more swiftly than analyst upgrades and downgrades.
An analyst’s change in rating, whether it’s from “Hold†to “Buy†or “Buy†to “Sellâ€, can spark significant price swings within hours. For active investors, understanding and timing these shifts isn’t about chasing the news; it’s about anticipating where sentiment is going next.
Why Analyst Ratings Matter
Analyst opinions serve as a compass for the market. A single change from a major firm like Goldman Sachs, Morgan Stanley, or J.P. Morgan can send a stock rallying or reeling within minutes of the opening bell.
These shifts, collectively known as analyst upgrades and downgrades, influence institutional algorithms, retail sentiment, and even media coverage. When a respected analyst lifts a company’s outlook, buying momentum can build fast. Conversely, a downgrade often sparks waves of defensive selling.
But here’s the nuance: the biggest gains or losses don’t usually come from the news itself. They come from how traders interpret that news and whether it aligns with or challenges existing expectations.
How to Use Upgrades & Downgrades Calendar
Our Upgrades & Downgrades Calendar can help you track, interpret, and capitalize on rating changes.
Each entry displays:
- The ticker symbol and company name
- The analyst firm issuing the rating
- The new rating (e.g., Buy, Outperform, Hold, Underperform)
- The previous rating for context
- The target price change, if provided
This structure allows you to scan dozens of updates in seconds. Users can immediately spot whether multiple firms are converging on the same outlook, a potential momentum confirmation, or whether a lone downgrade might signal a contrarian opportunity.
Reading Between the Lines of Rating Changes
The key to mastering upgrades and downgrades of stocks isn’t just knowing what changed — it’s understanding why.
Not all upgrades are created equal:
- Fundamental Revisions: When analysts raise ratings after strong earnings or improved guidance, that’s confirmation of a real shift in fundamentals.
- Valuation Calls: Sometimes a stock is upgraded simply because it’s perceived as “cheap†after a sell-off.
- Momentum Upgrades: Analysts occasionally chase performance by upgrading stocks that are already trending upward.
On the flip side, downgrades often carry asymmetric weight. Negative revisions tend to trigger sharper, faster moves because fear spreads more quickly than optimism. That’s why having instant access to today’s upgrades and downgrades briefing gives you an edge in planning your next move.
Timing Your Entry: A Framework That Works
Use this step-by-step approach to trade around ratings changes:
1. Pre-Market Prep: Review today’s upgrades and downgrades every morning. Focus on names with both:
- A large shift in rating (e.g., “Sell†to “Buyâ€)
- A new price target that significantly exceeds or lags the current price
2. Assess the Context: Check whether the stock is near earnings, at a technical support/resistance level, or in a sector with momentum. If multiple analysts issue similar revisions, treat it as confirmation.
3. Watch the First Hour of Trading: Institutional investors often adjust positions in the first 60 to 90 minutes after the open. If volume surges with price confirmation, it’s a valid signal that there is conviction in the move.
4. Plan Exits Before Entry: Because upgrades and downgrades can cause short-term volatility spikes, always plan both profit targets and stop levels before executing. Momentum can fade as quickly as it starts.
Spotting Momentum Clusters
One of the most powerful features the Upgrades and Downgrades Calendar is its ability to reveal momentum clusters like multiple upgrades or downgrades issued across a single sector.
For example:
- If several banks simultaneously raise ratings on semiconductor firms, it’s a sign it could presage a rotation into tech.
- If energy names receive broad downgrades following a drop in crude prices, it signals a sector-wide sentiment shift could be at hand.
In these cases, don’t just look at one ticker — scan for patterns. Clusters of upgrades and downgrades are often precursors to multi-week trends. They’re where institutional positioning begins to shift beneath the surface.
Separating Signal from Noise
Of course, not every analyst revision deserves attention. To filter effectively, ask these three key questions:
- Who issued the change? Major institutions tend to have a stronger market impact.
- Is the rating change aligned with price action? A “Buy†upgrade after a 20% run may already be priced in.
- Does volume confirm the move? Price without volume rarely sustains momentum.
This filtering process prevents overtrading and ensures you’re reacting to true catalysts of upgrades and downgrades rather than noise.
Using Historical Data to Refine Timing
Available past data allows traders to study how similar events played out in the past. For instance, you can analyze how a company reacted to a prior downgrade cycle. Did it sell off for a week, or rebound within two days? Historical data isn’t guaranteed to repeat itself and is meant to provide probabilities, not certainties. However, it provides valuable insights that can inform data-driven decisions.
With that insight, you can fine-tune your entry timing to align with statistically favorable windows, typically after the initial wave of emotional reactions subsides and the market settles into a trend.
Turning Insights into Action
The upgrades and downgrades calendar is updated throughout the day, allowing you to monitor shifts as they occur. When multiple analysts adjust their ratings within a short timeframe, it can provide actionable signals worth deeper investigation.
Whether you’re an experienced trader or a part-time investor, timing trades around analyst revisions helps you capture short-term bursts of momentum and align with broader sentiment cycles.
Make Your Next Move
Analyst ratings move markets, but whether they move your portfolio depends on how well you track and act on them. With Briefing.com’s updated calendar and expert commentary, you can stop reacting and start anticipating.
Claim your 14-day free trial today to gain access to our full suite of market-moving calendars and analyst coverage.
How to Trade Futures
Futures contracts give traders a way to engage with markets through exposure to an underlying asset. These contracts reflect the price of that asset and let traders act on their view of where the market may move. Many investors also use futures to hedge a position or to reach markets that are not available through traditional shares.
Futures can be useful tools once traders gain a solid grasp of how they work. They involve leverage and defined rules, so it helps to start with the basics before taking a position. This guide introduces those basics and outlines the steps involved in trading futures for the first time.
Futures Trading 101: What Are Contracts?
A futures contract is an agreement to buy or sell an asset at a predetermined price on a specific date. Traders use them to express a view on the future price of an index, commodity, currency, or interest rate product. Unlike owning shares or ETFs, a futures contract represents exposure to a notional value rather than ownership of the underlying asset.
How do futures contracts work? These characteristics define a contract:
- Contract size determines the notional value that the trader controls.
- Expiration cycles vary by product and dictate when the position settles.
- Margin rules allow traders to control large positions with a smaller upfront amount.
These elements help traders understand the scale of risk and the mechanics involved before initiating a position.
Futures Trading for Beginners: Types of Contracts Available
Futures markets cover a wide range of asset classes. Beginners often start with index contracts, but the landscape is broader.
- Equity Index Futures: Track benchmarks such as the S&P 500 or Nasdaq. They allow traders to participate in broad market moves without buying individual stocks.
- Commodity Futures: These cover crude oil, natural gas, gold, copper, corn, and other physical goods. Prices often react to supply and demand conditions, geopolitical shifts, and seasonal trends.
- Currency Futures: Follow foreign exchange pairs and enable investors to participate in currency movements.
- Interest Rate Futures: Reflect expectations for Treasury yields and short-term rates. They can react quickly to economic releases and Federal Reserve commentary.
- Micro Futures: Reduce the contract size to make exposure accessible for traders who want smaller positions. This allows beginners to learn the mechanics with less capital at risk.
How Does Futures Trading Work?
Futures markets rely on standardized contracts that trade on regulated exchanges. The exchange lists the contract and defines its specifications. Meanwhile, the clearing house guarantees performance on both sides of the trade.
In the United States, CME Clearing often fills this role. It becomes the buyer to the seller and the seller to the buyer. This removes direct counterparty risk and gives traders confidence that trades will settle.
Several concepts guide how futures trade:
- Long and short positions help traders express a directional view.
- Mark-to-market accounting updates gains and losses daily based on price changes.
- Initial and maintenance margins define the amount of capital required to open and hold a position.
- Leverage increases both potential gains and potential losses because traders control more exposure than their deposit amount.
At Briefing.com, we provide live commentary on futures contracts, price reactions, and market catalysts so traders can follow these moves as they develop. You can start a free, 14-day trial at any time to see our intraday futures coverage in action.
How to Start Futures Trading
Opening a futures account requires approval from a broker. Brokers review several futures trading requirements before approving an account, including trading experience, risk tolerance, and familiarity with margin rules.
Traders should also consider the following points:
- Minimum Funding Levels: Brokers may require a specific amount of capital in the account before allowing futures trades. This ensures traders can meet margin needs and manage position size responsibly.
- Contract Familiarity: Traders should understand the specifications of the contract they plan to trade, including size, tick value, and expiration. This knowledge supports better planning and risk control.
- Extended Trading Hours: Futures markets operate for much longer sessions than traditional equity markets. These extended hours can affect how positions behave and may introduce price movement outside of regular trading windows.
These considerations help traders prepare for the leverage and volatility that are common in futures markets.
Order Types Used in Futures Trading
Futures traders rely on several order types to manage entries and exits. These include:
- Market Order: Fills at the next available price
- Limit Order: Sets a maximum or minimum acceptable price
- Stop Order: Activates once the market reaches a defined leve
- Conditional Order: Helps automate parts of a strategy based on preset criteria
Liquidity can differ from one contract to another. Traders should understand tick size and tick value before placing a trade, since these measurements define how prices move and how gains or losses accumulate.
How to Trade Futures: Common Strategies
Beginners often start with simple strategies that help them learn how futures behave. The following are some common trading methods:
Trend Following
This strategy focuses on price direction. Traders look for signs that an uptrend may continue or that a downtrend may persist. The goal is to align the trade with the prevailing movement in the market.
Hedging
This tactic helps investors protect an existing stock or portfolio position. A futures position that moves in the opposite direction can offset part of the risk in the underlying investment.
Breakout and Range Trading
This uses defined price levels to identify potential turning points or continuation patterns. A breakout strategy reacts to moves above or below a key level, while range trading focuses on repeated moves within established boundaries.
Micro Contracts
These smaller contracts give new traders an accessible way to test strategies and manage exposure with lower capital requirements. They behave like larger contracts but carry reduced financial risk.
Any trading approach should include risk rules that account for leverage and market volatility.
Potential Risks to Understand Before Trading Futures
Apart from learning how to trade futures and its advantages, investors must also be aware of the risks. Futures can present challenges when leverage, volatility, or liquidity come into play. Traders who recognize these pressure points are better prepared to handle unexpected price movement.
- Leverage Risk: Leverage allows traders to control a large contract value with a smaller deposit. This creates the potential for large gains but also for significant losses if the market moves against the position.
- Overnight Gaps: Futures can open at different levels after a break in trading. These gaps may cause a position to shift in value before the trader has a chance to respond.
- Liquidity Differences: Some contracts trade more actively than others. Thin liquidity can lead to wider bid-ask spreads and less favorable execution.
- Margin Calls: Margin requirements must be maintained throughout the life of the position. A margin call occurs when the account balance falls below the maintenance level, which requires the trader to add funds.
- Event-Driven Volatility: Economic releases, policy remarks, earnings updates, and geopolitical developments can create sudden price swings in futures markets.
- Tax Considerations: U.S. traders may be subject to the 60/40 tax rule, which treats futures gains as 60% long-term and 40% short-term. This structure can influence how gains and losses are reported.
Stay Informed and Ahead with Briefing.com
Futures trading gives investors a way to participate in a wide range of markets. It offers tools for speculation and hedging, and it rewards traders who understand how futures contracts work and how margin influences risk. A strong foundation helps beginners approach these markets with confidence.
At Briefing.com, our focus is on delivering live market analysis that keeps traders informed. We follow futures contracts, market catalysts, and price reactions as they develop, and we provide context that supports data-driven decision-making.
See how our intraday coverage keeps you connected to the futures market. Explore our services, and sign up online today.
Leveraging Live Market Analysis for Intraday Trading Strategies
Intraday traders buy and sell financial instruments within the same trading day, making decisions as the market moves. Live market analysis helps active investors figure out what's pushing prices at any given moment and spot opportunities the broader market might be creating.
Live news combined with futures data give traders context. They can interpret price behavior better and gauge risk more accurately. Having that information available means traders can size up opportunities and adjust their approach without lag.
In this article, we explore how live insight into stock market futures and stock market news supports intraday trading strategies. Our goal is to provide an overview of intraday trading concepts while showing how live analysis helps turn information into actionable decisions.
Take a more informed approach to intraday trading. Subscribe now to try and explore live market analysis, trading ideas, and tools for free, designed for active investors and traders.
What Is Intraday Trading?
Intraday trading, often referred to as day trading, is the practice of purchasing and selling assets such as stocks during a single trading session. All positions are closed before the market closes, so traders don't hold anything overnight. The goal is to profit from small price movements throughout the day.
Day traders use technical analysis, charts, and market trends to quickly make informed decisions. This approach to trading requires active monitoring and decisive execution. While potential profits can be attractive, intraday trading is risky, as losses can accumulate. Successful day trading demands significant time, knowledge of markets, and emotional control.
The Role of Live Market Analysis in Intraday Decision-Making
Live market analysis provides context as conditions evolve. Prices change throughout the day, responding to headlines, data releases, and shifts in investor sentiment that occur in real time.
For intraday traders, delayed information limits flexibility. Live stock market news and market commentary help explain why prices are moving, not just how far they have moved. This information is essential as it helps traders understand the drivers behind price action. As a result, they are better equipped to adjust exposure or step aside when conditions become unfavorable.
Live market analysis does not eliminate risk, but it helps decision-making during fast-moving sessions.
Understanding Stock Market Futures for Intraday Context
Stock market futures often set the tone before the opening bell. Index futures reflect expectations for how markets may open based on overnight developments, global markets, or economic data released outside regular trading hours.
Even if you do not trade futures directly, they offer valuable context. Futures movement can signal early momentum, potential gaps at the open, or shifts in sentiment that may influence intraday price action. Many active investors monitor futures alongside equities to understand how the broader market environment is shaping up.
Common Intraday Trading Strategies: A Conceptual Overview
Intraday trading strategies come in many forms, but most fall into a few broad categories. Understanding what these strategies aim to capture helps clarify when they are most effective.
- Momentum-based strategies are often used when a stock begins to attract sustained buying or selling interest, with price movement reinforced by rising volume.
- Range-bound strategies work well on quieter days. Prices bounce between levels the market has already tested instead of pushing decisively higher or lower.
- Breakout and breakdown strategies matter when prices push past those familiar boundaries. That kind of move usually pulls in more participants and shifts momentum.
- News-driven strategies react to earnings, economic data, or corporate developments.
Rather than asking what the strategies for intraday trading are in isolation, it is more useful to understand which conditions favor each approach.
Trading Setups for Intraday Traders: What To Look For
Intraday setups are market conditions that tend to recur throughout the trading day. They can develop fast, so traders wait for confirmation before taking any position in a given trade. Setups aren't really about predicting where the market will go. They're about spotting when price behavior starts to take shape.
A few common ones:
- Opening Range Activity: Early price movement helps frame how the session might unfold.
- Momentum Continuation: Steady price action and volume suggest the move has legs.
- Pullbacks Within a Trend: Prices pause, then pick back up in the same direction.
- Range Expansion: Volatility kicks in after things have been relatively quiet.
Preparation and patience help traders respond consistently as these patterns emerge.
How Live Market Analysis Helps Identify High-Probability Setups
Live market analysis connects what's happening on the chart with what's driving it. Live commentary explains why certain stocks and sectors are heating up or why volatility just spiked.
Before the market open, stock market update helps frame the session before it gets going. Story Stocks point out which names are pulling focus and moving the market. In-depth analysis digs into how bigger macro events, investor sentiment, a technical factors are shaping intraday behavior.
When traders layer that context over their setups, they can weigh probability instead of just reacting on impulse.
Use live market analysis to stay aligned with market conditions in real-time. Subscribe now to try it free.
Risk Management: A Core Component of Successful Intraday Trading
Risk management is central to successful intraday trading strategies. Because trades unfold quickly, losses can accumulate just as fast if discipline breaks down.
Position sizing, predefined exits, and respect for volatility help limit downside exposure. Intraday traders also manage risk by limiting the number of trades they take during a session. Not every market environment supports active trading.
Effective risk management allows traders to remain objective, even when markets become unpredictable.
How To Learn Intraday Trading Strategies More Effectively
Many investors ask what are the strategies for intraday trading without unnecessary trial and error. Observation is a powerful teacher. Watching how markets respond to news, earnings, and economic data builds familiarity over time.
Reviewing post-market summaries, such as the after-hours report provided by Briefing.com, can help you connect intraday movement with broader outcomes, which strengthens your ability to recognize patterns and reinforce trading discipline. It takes consistency as you learn to spot the signals.
Final Takeaways: Turning Information Into Intraday Insight
By focusing on context, you can approach intraday decisions with greater confidence. Our team can help you learn and refine trading strategies with timely insight that supports better judgment.
Build your intraday trading framework with Briefing.com. We provide research and ideas that adapt as markets move.
Futures Trading Strategies: Hedging and Leverage
Market volatility impacts trading strategies, and the speed at which markets react to economic data, policy decisions, and global events continues to increase. Active investors can use futures contracts to plan for volatility rather than react to it. When used correctly, futures trading strategies can help hedge existing positions or increase market exposure with less capital than traditional investments.
In this guide, we provide an overview of futures trading, focusing on the strategic roles of hedging and leverage. We will also explore how live insight into stock market futures can help you make more informed decisions as market conditions change.
Take a more informed approach to futures trading. Subscribe now to try it free and see how live analysis and research support smarter investment decisions.
What Are Futures Contracts?
A futures contract is an agreement to buy or sell an asset at a set price on a future date. These contracts trade on regulated exchanges and apply to a wide range of markets, from commodities and interest rates to major equity indexes.
What sets futures apart is how they are funded. Instead of paying the full value of the asset upfront, traders post margin, which allows them to participate in price movements with a smaller capital outlay. For many investors, stock market futures offer a practical way to manage risk or prepare for shifts in overall market conditions without restructuring an entire portfolio.
Why Investors Use Futures: Hedging vs. Leverage
Most trading futures strategies fall into one of two categories: hedging or leverage. While both rely on the same instruments, the intent behind each approach differs.
Hedging focuses on reducing risk. Investors use futures to offset potential losses in an existing position, aiming to stabilize returns during periods of uncertainty. Leverage, on the other hand, is about efficiency. Futures allow traders to control a large notional position with relatively little capital, amplifying gains and losses alike.
Understanding this distinction is critical. The success of any futures strategy depends not only on market direction but also on clarity of purpose.
Hedging Strategies Using Futures
Hedging strategies using futures are commonly employed by investors who already have exposure to the underlying market. For example, an investor holding a diversified equity portfolio may use index futures to protect against a short-term market decline without selling individual stocks.
Commodity producers and consumers also rely heavily on futures hedging. By locking in prices ahead of time, they can reduce uncertainty around costs or revenues. While these hedges are rarely perfect due to factors such as basis risk, they can significantly reduce volatility when markets become unpredictable.
The value of hedging lies in preparation for individual investors. Futures provide a structured way to manage downside risk when market conditions begin to shift.
Hedging Futures with Options: Adding Risk Control
Some investors add another layer of protection by hedging futures with options. Options allow traders to define risk more precisely by limiting potential losses while maintaining exposure to favorable price movements.
For example, buying protective options alongside a futures position can help cap downside risk during volatile periods. This approach is particularly useful when markets are sensitive to upcoming economic data or policy decisions. Understanding how to hedge futures with options requires familiarity with both instruments, but the combination can offer flexibility that futures alone may not provide.
While options introduce additional costs, they can serve as an effective risk-management tool for investors seeking more control over outcomes.
Leverage in Futures Trading: Power With Responsibility
Leverage is a defining feature of futures markets. Because futures contracts are traded on margin, a relatively small amount of capital can control a much larger position. This capital efficiency is attractive, but it also increases risk.
Small price movements can impact account equity, and adverse moves may trigger margin calls. For this reason, leverage demands discipline. Successful futures traders pay close attention to position sizing, volatility, and liquidity. Leverage should support a well-defined strategy, not replace sound risk management.
Leverage-Based Futures Trading Strategies
Leverage-based futures trading strategies are often used by active investors who seek short- to medium-term opportunities. These may include directional trades based on macroeconomic trends, tactical positioning around earnings seasons, or responses to shifts in interest rate expectations.
Some traders also explore automated futures trading strategies, where rules-based systems execute trades based on predefined signals. While automation can remove emotion from decision-making, it does not eliminate risk. Strategy design, testing, and ongoing monitoring remain essential.
Regardless of approach, leverage should be applied deliberately, with a clear understanding of potential outcomes.
How Market Data Supports Futures Decisions
Futures markets respond quickly to economic releases, central bank decisions, and corporate earnings. In many cases, prices begin moving well before the headlines hit. That is why access to timely, reliable market intelligence plays such a central role in futures trading.
By tracking live stock market news and futures data, you can better anticipate periods of heightened volatility and plan accordingly. Instead of reacting after prices have already adjusted, informed investors use data to prepare in advance.
With Briefing.com, you can stay focused on the events that matter most to futures markets, including:
- Live stock market futures data to monitor overnight and intraday market direction
- Economic calendars and earnings insights that highlight upcoming market-moving events
- Timely market commentary that separates meaningful signals from short-term noise
Using live insight into stock market futures allows you to align trading decisions with broader market conditions, not just moment-to-moment price swings.
When Futures Trading Makes Sense
Futures trading is best suited for investors who actively monitor markets and understand the mechanics of leveraged instruments. It can be an effective tool for managing risk or expressing market views, but it is not designed for passive, long-term investing.
If you prefer a hands-off approach or are uncomfortable with short-term price fluctuations, futures may not align with your objectives. For those willing to invest time in education and preparation, however, futures can add flexibility and precision to a broader investment strategy.
Key Takeaways: Building a Smarter Futures Trading Foundation
Futures contracts offer powerful tools for both hedging and leverage, but they require careful planning and discipline. Hedging strategies help manage uncertainty, while leverage enhances capital efficiency when used responsibly. The common thread across all futures trading strategies is preparation.
By combining a clear strategy with timely market insight, investors can approach futures trading with confidence rather than speculation.
Put market insight behind your futures decisions. Claim your 14-day free trial now.
Sector Rotation Strategies with Market Share Analysis
If you have been investing for any length of time, you’ve likely seen how market leadership can change. Sectors that outperformed last quarter can lose momentum when certain economic expectations shift. Traders need to understand how those transitions reflect the repositioning of institutional capital. Identifying those shifts early using the right tools can provide a measurable advantage.
That process is known as sector rotation, the movement of capital from one industry group to another as economic conditions evolve. Rather than viewing the market as a single, unified trend, disciplined investors analyze which sectors are gaining relative strength and which are beginning to weaken.
Sector performance often changes before the wider market story catches up. Big institutions react to things like interest rates, earnings updates, and economic reports. These changes usually show up first in price trends and relative strength. By the time the news covers a sector, much of the move may have already happened.
At Briefing.com, we provide our clients with a disciplined framework for evaluating sector performance through structured stock market analysis. Follow our daily stock market update to monitor sector leadership as it develops.
What Is Sector Rotation and the Forces That Drive It?
Economic cycles have a huge impact on sector leadership. As growth accelerates, peaks, slows, or contracts, different industries tend to benefit at different times.
While no rotation pattern can be timed precisely, historical data show that leadership often follows a recognizable progression tied to shifts in economic momentum:
- Early Cycle: Financials and consumer discretionary
- Mid Cycle: Technology and industrials
- Late Cycle: Energy and materials
- Defensive Phases: Utilities, healthcare, and consumer staples
The shifts in these cycles reflect the changing economic conditions. For example, when interest rates rise, it can pressure long-duration growth stocks while improving margins for financials. On the other hand, slower economic growth pushes capital toward defensive industries with stable cash flows. During expanding earnings cycles, cyclical sectors tend to attract renewed institutional interest.
Understanding the market sector rotation model allows you to align portfolio exposure with prevailing economic trends rather than reacting after leadership has already changed.
Using Share Market Analysis to Identify Leadership
Recognizing rotation is one thing. Identifying it early is another. Structured share market analysis allows investors to focus exclusively on individual stocks. However, sector-level strength often precedes individual breakouts. When capital enters an industry group, leading stocks within that sector tend to follow.
How Share Market Analysis Reveals Rotation
Sector rotation becomes visible in data before it becomes obvious in headlines. The key is knowing what to measure and how to interpret it in context. Effective sector-level share market analysis focuses on a few core indicators that reveal where institutional capital is concentrating.
- Performance Rankings: Which sectors are outperforming the S&P 500?
- Relative Strength Comparisons: Is leadership accelerating or fading?
- Breadth Data: Are gains broad within the sector or concentrated in a few names?
- Volume Confirmation: Is institutional participation supporting the move?
A well-constructed stock market sector rotation chart can help you visualize these factors and how they work together. Heatmaps and relative performance tables further clarify these transitions, turning what might otherwise feel subjective into measurable shifts in capital allocation.
At Briefing.com, we combine sector performance data with structured commentary so you can identify the sectors that are leading and what’s driving the shift. When analyzing these changes, context can help you understand the forces behind the numbers. This leads to more deliberate decisions backed by objective information.
For deeper context behind shifting leadership, review our structured in-depth analysis that connects macro data to sector performance.
Building a Sector Rotation Strategy Step-by-Step
Understanding rotation is valuable and applying it consistently is what improves results. A disciplined sector rotation strategy begins with structure and precision.
Step 1: Assess the Broader Market Environment
Evaluate how broadly the market is participating in the move. Check if more players are confident and risk-seeking or more cautious and defensive. Sector rotation tends to work best when it aligns with the broader market environment, so understanding that backdrop should come first.
Step 2: Identify Sustained Leadership
Pay attention to sectors that are consistently performing for several sessions or weeks. When a sector continues to hold its ground during pullbacks and participates meaningfully during rallies. This is the type of consistency that usually signals institutional interest.
Step 3: Look Beneath the Surface
Investigate the sectors you identified and determine whether they show broad participation. If only one or two stocks are driving gains, it could mean the move lacks depth. Review the breadth and volume trends and confirm whether institutional capital is truly committing to the space.
Step 4: Narrow Your Focus to the Strongest Names
Once leadership sectors are clear, concentrate on the companies demonstrating consistent strength within those groups. After isolating leading industries, refine your entries by identifying swing trading setups among the top performers.
Consistency matters in this type of strategy. Sector rotation is not about constant repositioning. You need to use measured adjustments as leadership evolves.
Common Mistakes in Market Sector Rotation
As you develop a well-designed sector rotation strategy, you should pay attention to certain pitfalls in your execution, which can make your approach more reactive. Here are a few common missteps that traders tend to make:
- Chasing Extended Moves: This happens when you jump into a sector after a long run higher, which often means arriving late, when much of the upside has already been captured.
- Over-Rotating Too Quickly: Constantly shifting exposure based on short-term headlines can create unnecessary churn and make it harder to build meaningful positions.
- Ignoring Breadth: This refers to mistaking sector leadership when only a handful of stocks are driving gains.
- Confusing Volatility with Rotation: A brief pullback does not always signal a structural change in leadership.
Stay Aligned with Market Leadership
At Briefing.com, we help investors track sector leadership with structure. We provide clarity as markets shift, so you don’t have to chase every movement. Leverage tools that help you recognize where strength is building and adjust your position based on actual data.
Are you ready to incorporate effective sector rotation strategies? Start your 14-day trial and access our structured market insights today.
How to Prepare for the Trading Day
Senior Technical Analyst Scott Smith, CMT discusses how he prepares for and approaches the markets each day. Get a detailed view of his daily routine and favorite Briefing.com features for identifying potential trading opportunities.
Discover techniques for identifying strong trends and momentum and learn a quick, top-down approach to recognize favorable and unfavorable trading environments. Learn how to establish a routine for monitoring the current market conditions and how to create a trading plan and maintain discipline to meet your goals.
Watch now to maximize your service and get the insight you need to improve your trading technique.
Identifying Swing Trading Setups in Leading Sectors and Stocks
Senior Technical Analyst Scott Smith, CMT discusses how to utilize technical analysis to get an edge on trading. Get a detailed look at Briefing.com's popular TA Page Scans column, which provides specific computerized scans based upon specific technical criteria and is designed to help both Day and Swing Traders identify profitable trading opportunities.
Watch the video to learn how to best identify leading sectors and stocks showing relative strength, how to spot low-risk, high-reward opportunities setting up for a swing, and which warning signals to look for to minimize your risk.
Get tips for planning exit strategies and learn the most effective method for letting your winners ride.
How to Avoid Costly Mistakes When Markets Shift from Overdrive to Neutral
Our team of senior trading analysts discuss mistakes they have made over the years that may save you from experiencing the same pain. Watch as they highlight strategies they utilize as the markets shift gears and provide tips for becoming a more disciplined trader.
Learn how they use Briefing Trader to assist in their own trading and get specifics on the team's different trading styles.
Risk and Money Management for Day Trading
Senior market analyst Brett Manning (ChartTrader - CHART) quickly covers the most important concepts for effectively managing risk and exposure as a short-term trader, including:
- How to gauge size for a trading setup as a function of stop placement.
- How to define the concept of a setup in terms of risk and a ratio to potential gains.
- Why cutting losses and letting profits run is instinctively difficult, but crucial.
- Why you must understand the time frame of your trading setup and adjust risk and size accordingly.
Watch the video now and implement techniques to help you effectively manage your day trading risk.
An Introduction to Futures Trading
Our senior market analyst Brett Manning (CHART – ChartTrader) gives a thorough account of the tools, concepts, and strategies requisite for a transition into involvement in the Futures markets.
Watch this video to learn basic concepts including symbology, expirations, order types, and broker considerations, as well as the psychological, philosophical, and tactical considerations in defining setups. Gain insight on the lessons learned during his 20 years of active involvement in the futures markets.
Expand Your Trading Horizon with Flexible Strategies
Watch this video as senior market analyst Brett Manning (CHART – ChartTrader) provides strategies for moving beyond the noise of individual equities and focusing on opportunities in equity indices currencies and commodities using ETFs and Futures.
Strategies for Trading Commodity-Focused ETFs
ETFs are an excellent way to participate in commodities volatility. But you must understand the specific flaws inherent in the underlying structure of these instruments or it could turn into an unpleasant experience.
Join senior markets analyst Brett Manning (CHART – ChartTrader) as he breaks down these ETFs and discuss how they are frequently misunderstood to the detriment of investors and traders. He’ll walk you through the extensive range of ETF choices and how to account for leverage and futures exposure. You’ll also get a breakdown of some of his big trades (gold, copper, & crude) and review key trends including the effect of QE and speculation.
Watch the video to learn from an expert trader and get the insight you need to improve your commodity-focused ETF trading technique.
Strategies for Reading Market Behavior
Senior Market Analyst Brett Manning (CHART) provides a behind-the-scenes view of his approach to the markets, including a detailed look at pattern analysis, sentiment data, and selection of market focus. Take a tour of his charting/market interface setup and get insight on how he tracks markets during the day.
Watch this video to learn a VIX-based approach to market focus, why sentiment data is important, and how to make sense of it to your advantage. You’ll also learn how to think in terms of "strong hands and weak hands" when reading market action.
Don’t miss Brett’s review of day trading examples, including charts and a detailed discussion on his underlying thought process as well as a review of larger time frame macro positions, strategic considerations, and other insights.
A Brief Guide to Bitcoin Futures
The advent of Bitcoin Futures promises to be a significant moment for Bitcoin, the wider cryptocurrency marketplace, and the world of futures markets. Watch this video as our senior markets analyst Brett Manning (CHART - ChartTrader) covers the most important concepts and dynamics involved in this new market. You'll learn basic specs for BTC Futures, who this brings into the market, the most important consequences of BTC futures, and CHART's thoughts on where this story will go from here.
Playing Offense in a Rising Interest Rate Environment
Chief market strategist Damon Southward discusses a few simple ways to hedge your portfolio to prepare for a higher interest rate environment. Watch the video now to learn which REITs he is buying and selling, which Preferred stocks are producing 8-9% yields and will go higher with rising rates, double-digit yield plays amid an improving economy, which Distressed opportunities will provide 100% plus upside as balance sheets improve, and options plays for portfolio hedging and income.
How to Avoid Heavy Losses in a Choppy Market
In this video, the Briefing Trader team discusses their strategies for navigating market volatility. You’ll learn how to identify new leadership stocks and avoid big losses chasing former high-flyers that have lost their wings. The team also provides historical context for recent price action and how it should impact your near-term trading. Watch now for insight and techniques to immediately improve your trading in a volatile market environment.
Risk and Money Management for Long-Term Investing
In this video, senior equity analyst Robert Reid covers the importance of scaling in and out as well as how to use stops to protect yourself. You’ll learn the difference between a stop loss vs. a stop limit, where to look for good investing ideas, and how to pick the right stocks to begin with.
Watch the video now and learn techniques to help you effectively manage long-term investment risk.
Risk and Money Management for Swing Trading
Senior technical analyst Scott Smith, CMT (BlueChipTrader - BLUEX) covers management strategies from a swing trader’s perspective. Watch this video as he reviews his simple “profitunity†table showing just how much you should be looking to make each day, week, or month to achieve a bigger picture goal. You’ll also learn why Average True Range (ATR) is a key indicator in figuring out expected range behavior.
Scott’s bottom line? Trade small enough to easily meet your target goals and risk based off a stock’s volatility. Watch the video now and implement techniques to help you effectively manage swing trading risk.